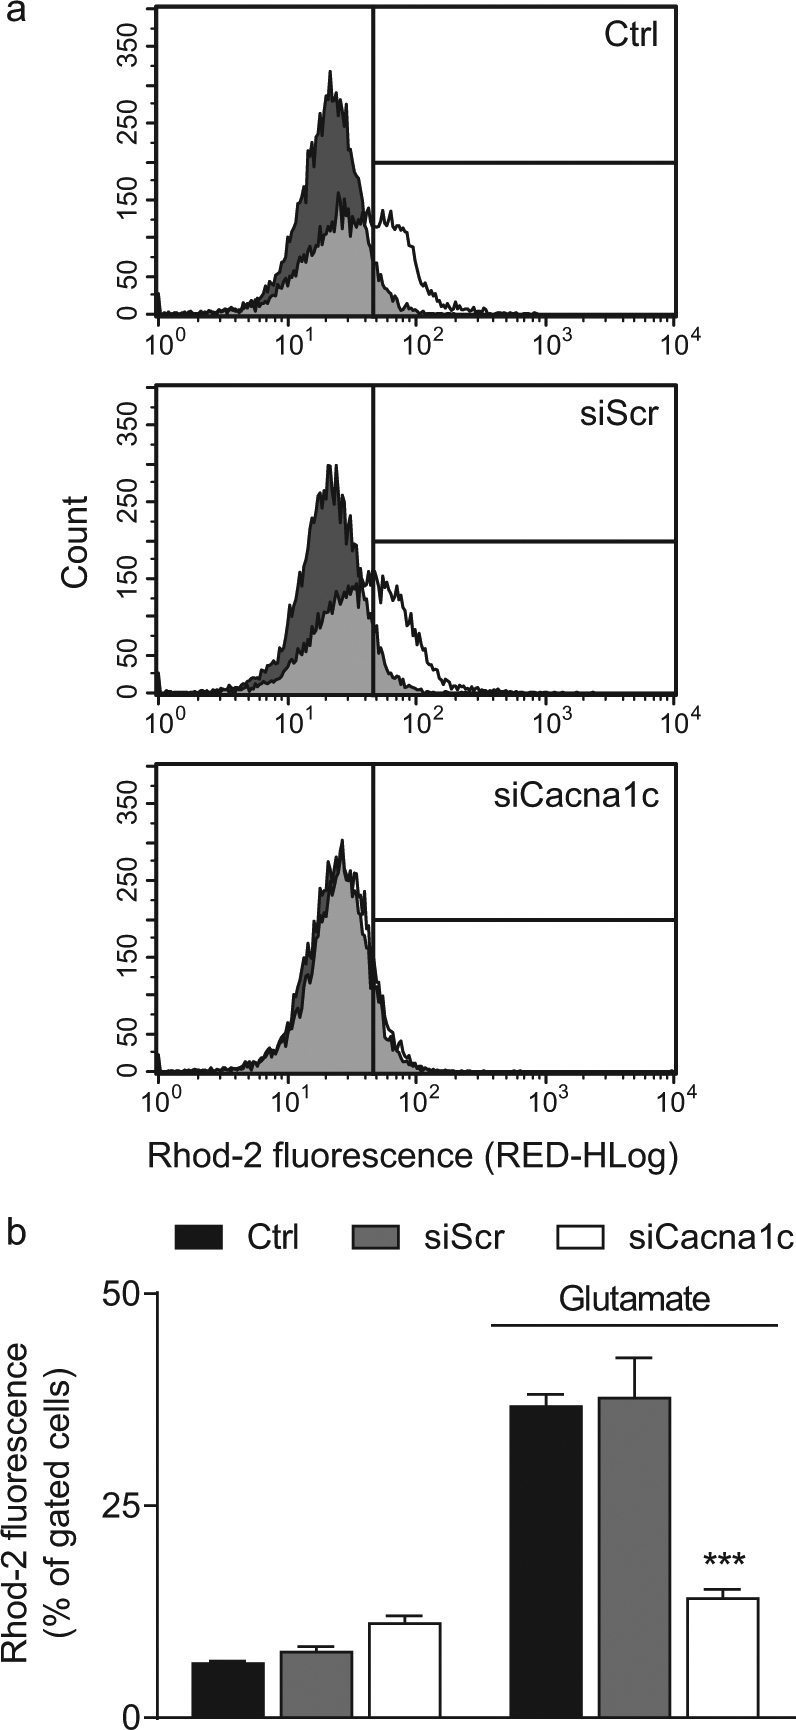
Fig. 4. Depletion of Cacna1c attenuated the glutamate-induced rise in mitochondrial calcium concentration.

a The mitochondria-specific dye dihydrorhod-2 AM was used for the flow cytometric calcium measurements. The dark grey graphs represent the untreated controls, the white graphs the glutamate-treated samples, and the light grey areas the overlay of both graphs. b Here, the right shift in Rhod-2 fluorescence in response to 11 mM glutamate was quantified. The bar graph shows one representative experiment with three replicates per sample (mean + SD; 10,000 cells per replicate). ***p < 0.001 compared to glutamate-treated ctrl (ANOVA, Scheffé’s-test)
