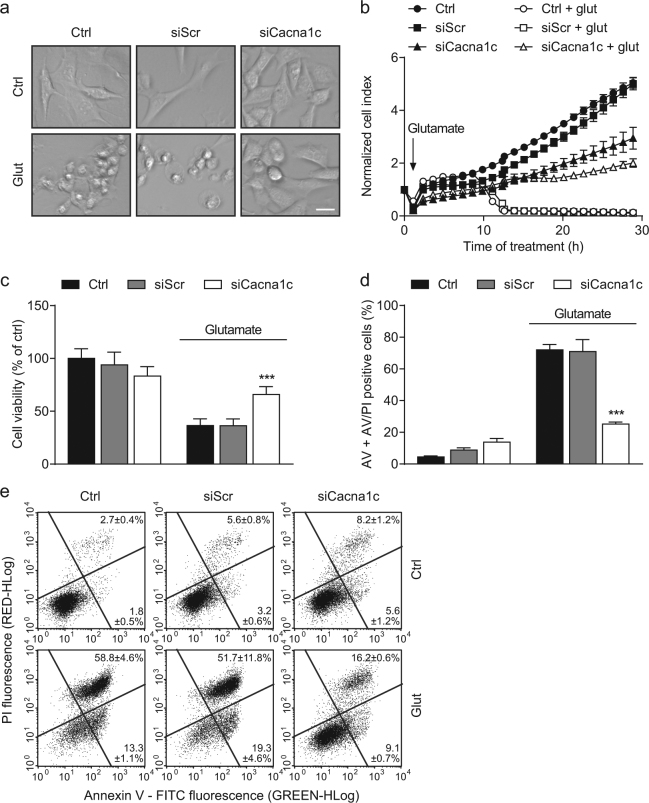
Fig. 5. Cacna1c silencing protected HT22 cells from glutamate-induced cell death.
a Representative phase-contrast images of glutamate-treated HT22 cells illustrate changes in cell morphology. Scale bar 25 µm. b A representative real time cell impedance measurement over 30 h after the treatment with 8 mM glutamate is shown. Eight replicate wells per condition are displayed as mean ± SD. c Before cell viability was determined by MTT assay, HT22 cells were challenged with 8 mM glutamate for 16 h. Values from 8 wells per condition are presented as mean + SD. The absorbance under control conditions is set as 100%. d The bar graph shows the percentage of annexin V and AV/PI positive cells. One representative experiment with three replicates per sample is depicted (mean + SD; 10,000 cells per replicate). e In addition, the dot plots exemplify the subdivision into AV (lower right quarter) and AV/PI positive cells (upper right quarter). AV annexin V, PI propidium iodide. ***p < 0.001 compared to glutamate-treated ctrl (ANOVA, Scheffé’s-test)

