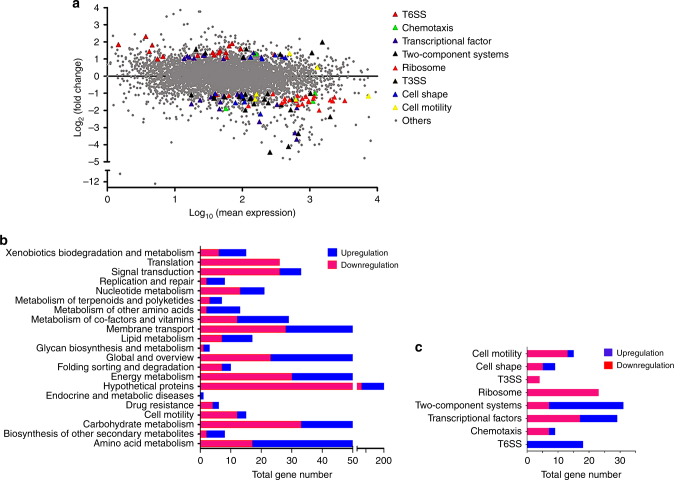
Fig. 4.
Transcriptome analysis of strains 1–9 and PAK-AR2. a X-axis represents the logarithm-transformed value of gene expression levels. Y-axis represents log2-transformed value of expression change folds. Genes belonging to different pathways are represented by various colored shapes as indicated. Others represent genes not belonging to the indicated pathways. b Expression profiles of the genes belonging to the cellular processes in KEGG_B_class. c Expression profiles of the genes belonging to the indicated metabolic pathways. Red color shows the genes with significantly reduced transcription levels. Blue color shows the genes with significantly elevated transcription levels

