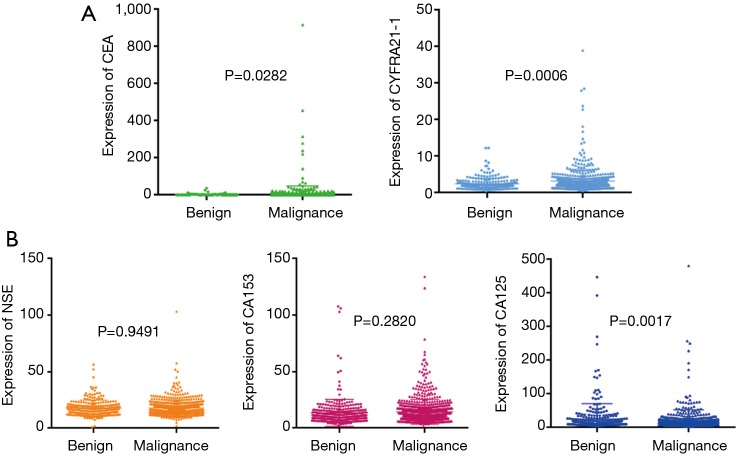
Figure 1.
Clinical distribution of all SPNs. The pie chart (A) shows the distribution of SPN histological types. The expression comparison of tumour serum protein markers is shown in (B). P values were calculated by an unpaired t-test. Different colour indicates different markers; dot indicates benign SPN; little triangle indicates malignant SPN. Other cancer, malignant SPNs that cannot be categorized by the listed cancer types. SCLC, small cell lung cancer; SPN, solitary pulmonary nodule.

