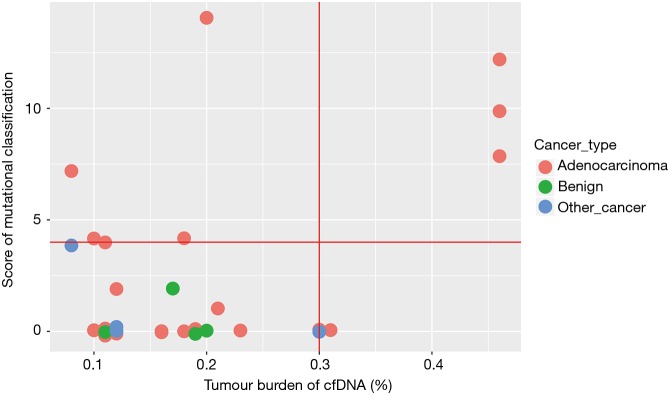
Figure 4.
Benign/malignant SPN distribution. TMS and TMB of SPN distribution, which was calculated by in-house software. Different colour indicates different type of SPN. Other cancer, malignant SPN except adenocarcinoma. TMB, tumour mutational burden; TMS, ctDNA mutational score; SPN, solitary pulmonary nodule.

