Figure 2.
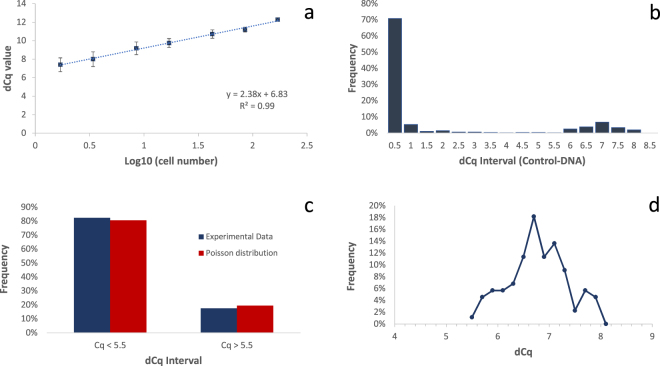
(a) Linear correlation of cell number and dCq value of Control DNA. After coWGA of various cell numbers, dCq is determined in real-time PCR. The dCq value of Control-DNA is plotted against the common logarithm (log10) of cell number. The standard deviation is given as error bars. The dCq value of co-amplified Control-DNA clearly correlates with the common logarithm of cell number used in WGA. (b) Frequency of WGA reactions characterized by dCq intervals of co-amplified Control-DNA: WGA was performed using Control-DNA and a cell dilution of 0.2 cells/WGA. As expected from Poisson distribution, most reactions did not contain any cell and resulted in a low dCq value. dCq values of ~7 represents WGA reaction containing at least a single cell. (c) Comparison of experimental data and Poisson distribution after WGA with 0.2 cells/WGA in average. WGA reaction with dCq value < 5.5 correlated with expected fraction of WGA reactions containing 0 cells. The second cluster of WGA reactions (dCq > 5.5) correlated with expected fraction of WGA reactions containing at least one cell. (d) Distribution of dCq value intervals of 0.2 cycles of WGA reactions containing cells.

