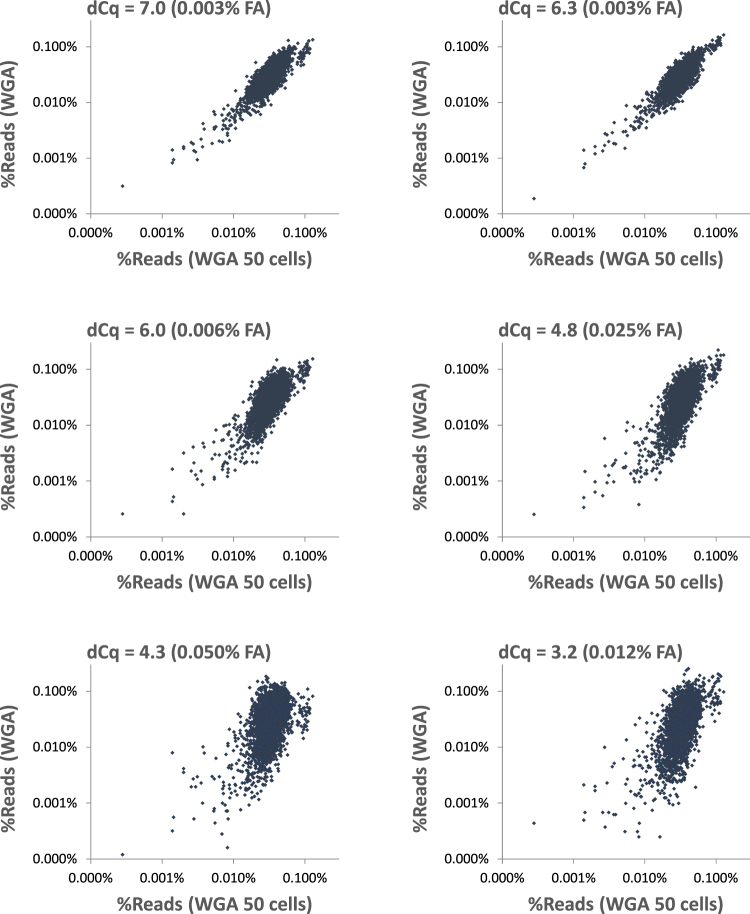
Figure 5.
Single cell WGA vs WGA of 50 cells. The figures show scatter plots of relative read counts mapped to human genome 1 mbp bins after WGA sorted according to their dCq value of Control-DNA. On the X-axis relative read counts are represented of WGA reaction of 50 cell sample that were not treated by formaldehyde. On Y-axis, relative read counts are shown of samples with a single formaldehyde treated cell on average. The formaldehyde concentration (FA) is indicated. All WGA reactions were performed in the presence of competing Control-DNA. WGA reactions were selected according to their dCq value of Control-DNA for NGS (see headline of scatter plots). Deviation of read counts correlated with dCq value of Control-DNA after WGA and formaldehyde treatment. The higher the formaldehyde concentration is for DNA damaging within cells, the higher is the deviation of read counts and the lower is the dCq value. Exception is the WGA reaction characterized by a dCq value of 3.2 (last panel). Here, the formaldehyde concentration is intermediate but resulted in high deviations of read counts. It is most likely that this cell was already damaged prior to formaldehyde treatment. Therefore, an intermediate formaldehyde concentration is enough to damage the single cell DNA strongly. However, the dCq value is a good indicator for sequencing outcome also for this cell.

