
Fig. 6.
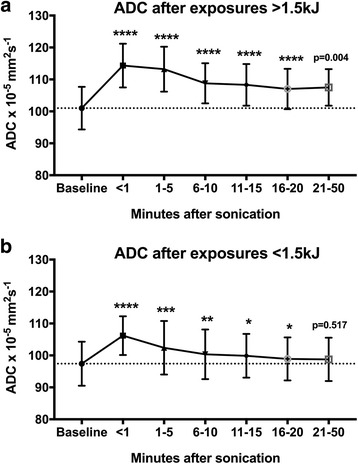
Apparent diffusion coefficient (ADC) values (mean ± SD) as a function of time after sonication for a delivered energies above 1.5 kJ remained significantly higher than baseline (dashed line) 21–50 min after sonication (p = 0.004), whereas b for exposures below this threshold value had almost returned to baseline values at this time point (p = 0.517). ****p < 0.0001, ***p < 0.001, **p < 0.01, *p < 0.05