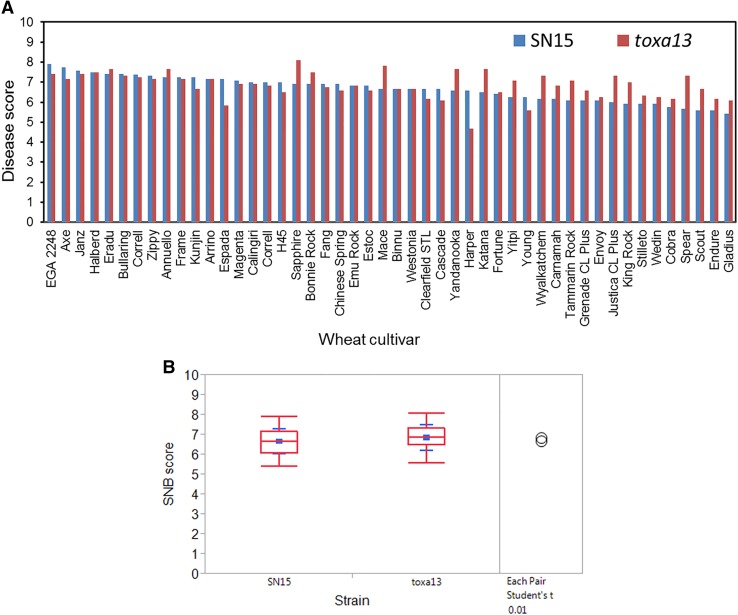
Fig. 1.
Pathogenicity assay of SN15 and toxa13 on Australian wheat cultivars and Chinese Spring. a Disease distribution of SN15 and toxa13. b Pairwise comparison of average disease scores of SN15 and toxa13 using a t test (left panel). Non-overlapping circles indicate that means are significantly different (P < 0.01). The red box plot is an indicator of median distribution, whereas blue annotation indicates the mean and standard deviation (right panel). The experiment was performed in biological triplicates (Supplemental data 1)

