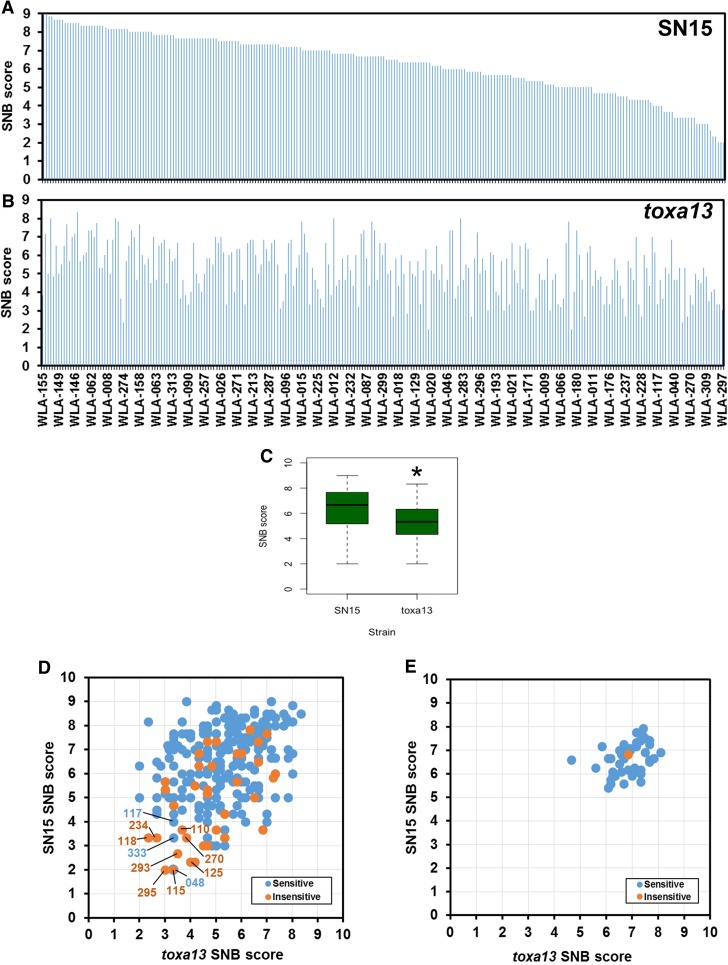
Fig. 2.
Comparison of SN15 and toxa13 infection scores on the Vavilov wheat collection. Wheat accessions arranged from the highest to lowest SN15 SNB scores for a SN15 and b toxa13. c Average SN15 and toxa13 disease scores. Asterisk denotes significant difference (P < 0.01) based on a weighted means t test. Dot plot comparisons of SN15 and toxa13 SNB scores on d Vavilov accessions and e Australian wheat cultivars and Chinese Spring. SnToxA-, SnTox1- and SnTox3-insensitive accessions are shown. Selected UQ SSD line no (prefix ‘WLA’) is shown in panels a, b, and d. Accessions were considered insensitive with an average effector-sensitivity score of ≤ 1 (Tan et al. 2014)

