Fig. 4.
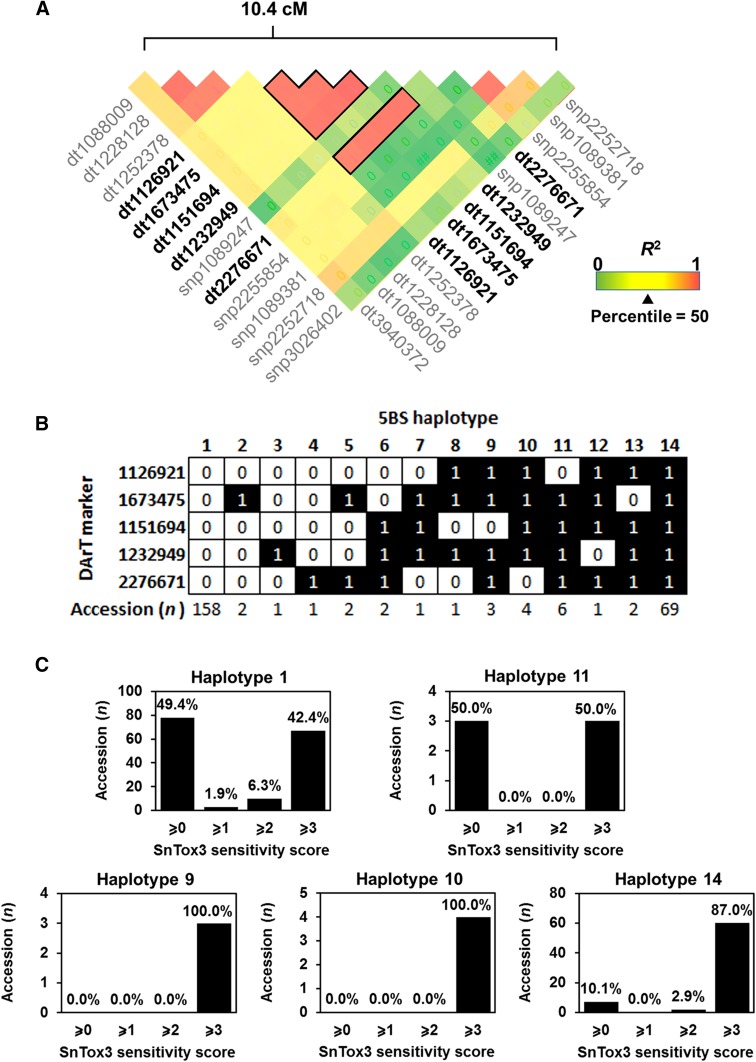
Haplotype analysis of the 5BS QTL associated with sensitivity to SnTox3. a Heat map showing pairwise linkage disequilibrium between marker pairs. Linkage disequilibrium blocks for five markers that were associated with the SnTox3 response are indicated. Prefixes; ‘dt’ indicates DArT markers and ‘snp’ for SNP markers. b 14 haplotypes were identified in the Vavilov wheat collection based on five linked markers. ‘1’ and ‘0’ designate two alleles for each marker. c Frequency of SnTox3 sensitivity in accessions across five major haplotypes

