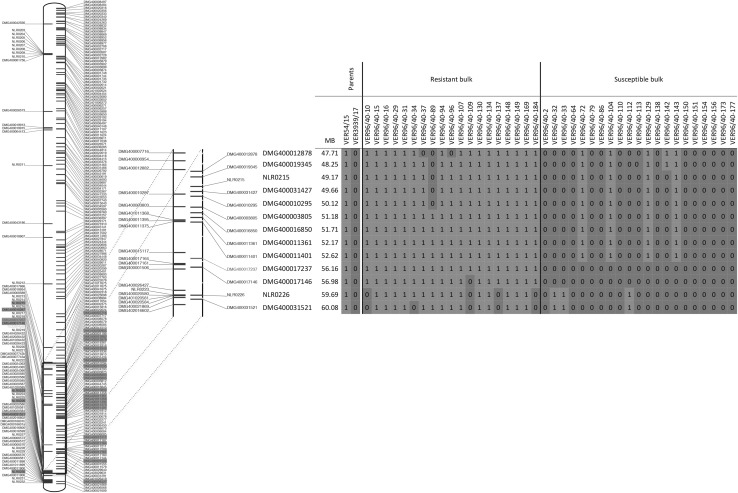
Fig. 3.
Graphical representation of the RenSeq and GenSeq mapping data on chromosome 9. Shown on the left is an overview of chromosome 9 with the positions and identities of resistance genes represented by RenSeq probes shown in green and single/low-copy number genes represented through GenSeq probes in blue. Highlighted in yellow are RenSeq or GenSeq represented genes that show polymorphisms associated with the resistance. A close-up of the interval with significant polymorphism is shown in the middle and genes for which we designed KASP markers are positioned on the right side. The additional KASP marker developed for DMG400017237 that co-segregates with the resistance is shown in red. The position of these genes, based on DM, is shown in Mb (mega-bases). The graphical genotyping results are shown on the right. The resistance genotype as found in Ver54 (homozygous) is represented with a green ‘1’ and the susceptible genotype associated with Ver3939 (homozygous) is represented as a blue ‘0’. The genotypes of 19 resistant and 21 susceptible plants, used in the bulked-segregant analysis, are shown. Recombination points are identifiable for when the genotypes alternate between green resistance allele (1) and blue susceptible allele (0) and vice versa (colour figure online)

