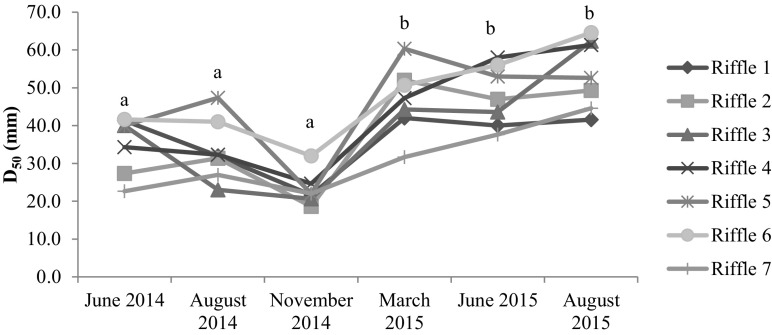
Fig. 2.
Median sediment size, D50, by study riffle over time (F5,70 = 12.44, p < 0.0001). Riffle 1 is the reference riffle, riffle 2–6 are upstream (of previous dam), and riffle 7 is downstream of the previous dam. Significant pairwise differences are indicated by different letters a and b (Tukey’s HSD: p < 0.05). For visual clarity, error bars are not included. However, please see Supplementary Material: Table S1 for details on data variability

