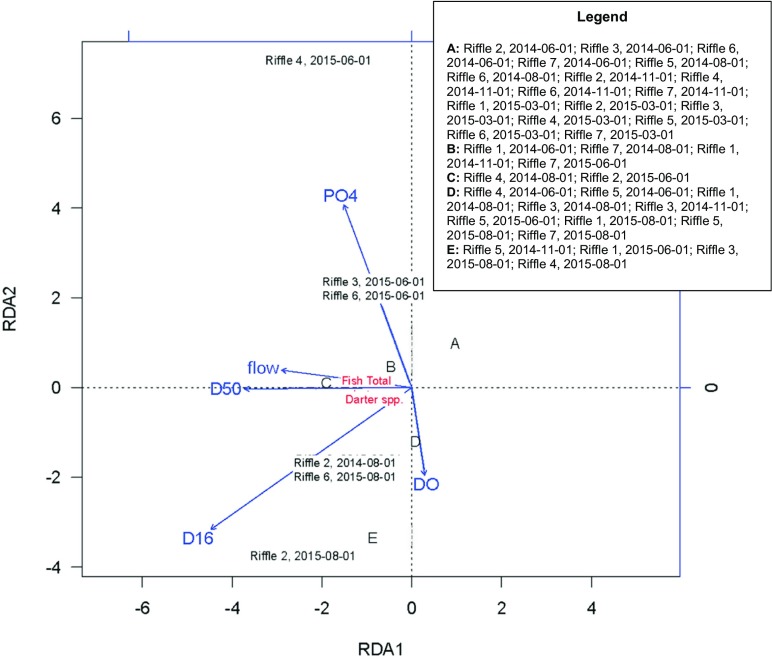
Fig. 6.
Redundancy analysis (RDA) of fish density (fish total), and darter species richness (Darter spp) at each study riffle across all the time steps. Blue arrows indicate how environmental variables were ordinated. Overall, there were 42 riffle/date combinations but only 9 unique scores. Where possible, riffles and time steps (e.g., Riffle 3, 2015-06-01) are included in the plot. For locations where labels would overlap and be illegible, letters A, B, C, D, and E represent the respective riffles and time steps as listed in the legend

