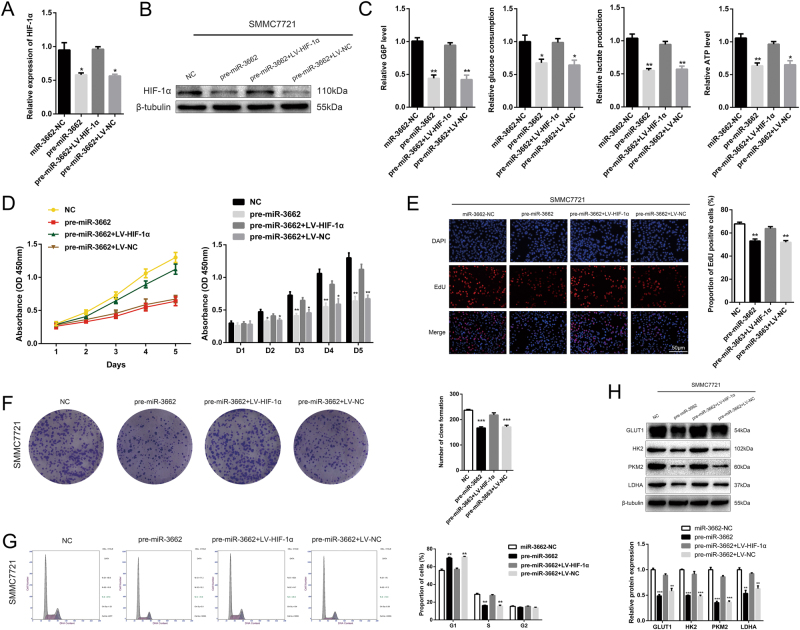
Fig. 6. Rescue experiments are performed to confirm that HIF-1α is the functional target of miR-3662 on HCC progression.
a, b Expression of HIF-1α at the mRNA and protein in the SMMC7721 cells transfected with miR-3662 overexpression lentivirus (pre-miR-3662) and HIF-1α overexpression lentivirus (LV-HIF-1α). Experiments were performed in triplicate. **P < 0.01 compared with the negative control group. c Cellular G6P level, glucose consumption, lactate production, and cellular ATP level in SMMC7721 cells co-transfected with pre-miR-3662 lentivirus and LV-HIF-1α (three independent experiments per group). *P < 0.05, **P < 0.01 compared with the negative control group. d CCK-8 analysis of SMMC7721-pre-miR-3662 cells transfected with LV-HIF-1α or LV-NC. Three duplicates were performed for each group, and three independent experiments were performed. *P < 0.05, **P < 0.01 compared with the negative control group. e 5-ethynyl-2′-deoxyuridine (EdU) incorporation analysis of miR-NC, pre-miR-3662, pre-miR-3662 plus LV-HIF-1α, and pre-miR-3662 plus LV-NC in SMMC7721 cells. EdU positive cells were counted from three random microscopic fields for each well, and these experiments were repeated three times independently. **P < 0.01 compared with the negative control group. f Colony formation ability of SMMC7721-pre-miR-3662 cells transfected with LV-HIF-1α or LV-NC (three independent experiments per group). ***P < 0.001 compared with the negative control group. g Cell cycle analysis of SMMC7721-pre-miR-3662 cells transfected with LV-HIF-1α or LV-NC. Three experiments were performed for each group. Three independent experiments were performed. **P < 0.01 compared with the negative control group. h Western blotting analysis of GLUT1, HK2, PKM2, and LDHA protein levels in SMMC7721-pre-miR-3662 cells transfected with LV-HIF-1α or LV-NC. Three independent experiments were performed. **P < 0.01, ***P < 0.001 compared with the negative control group. All data are represented as the means ± S.E.M

