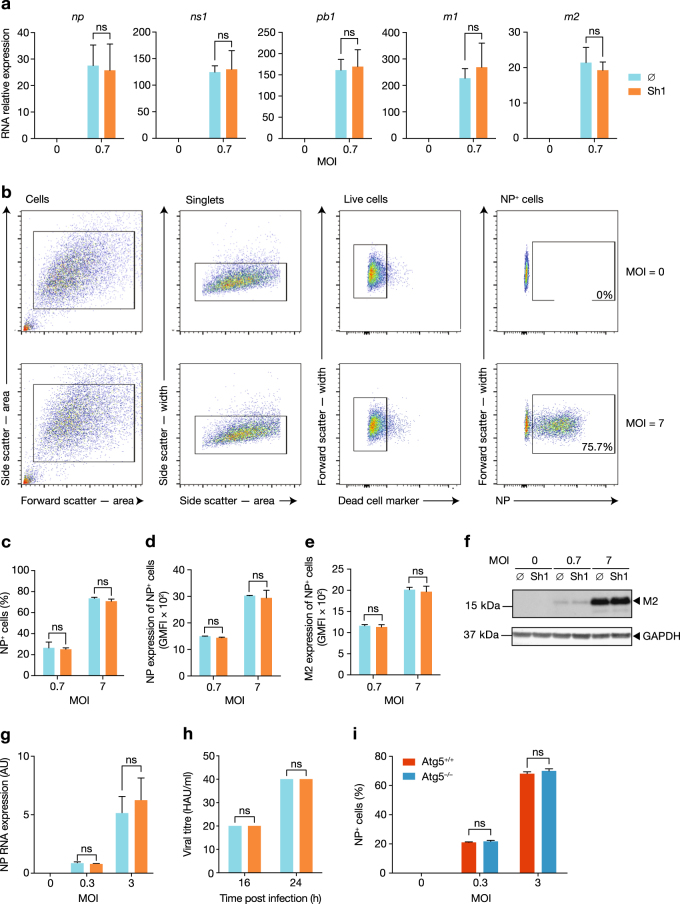
Fig. 2. ATG5 stabilization does not impact IAV replication.
a Following 5 h infection, with or without Shield1 (Sh1) pretreatment, IAV RNA expression levels were determined using RT and qPCR primer/probe sets specific for the NP, NS1, PB1, M1 and M2 genes. b–d ATG5DD cells, with or without Sh1 treatment, were infected with IAV for 16 h at the indicated MOI. The gating strategy after nucleoprotein (NP) immunostaining and flow cytometry is shown for two samples: uninfected, and infected at an MOI of 7 (b). The percentage of NP-expressing cells (c) and the geometric mean fluorescent intensity (GMFI) of NP per cell (d) were determined by flow cytometry. e, f IAV M2 expression was determined using flow cytometry (e) and immunoblotting (f) following 16 or 20 h infection at the indicated MOI, respectively. g ATG5DD cells, pretreated or not with Shield1 (Sh1), were infected for 16 h at the indicated MOI. NP RNA expression in supernatants was analysed by RT–qPCR. h ATG5DD cells, pretreated or not with Shield1 (Sh1), were infected at MOI 3 for the indicated times; haemagglutination assays were used to quantify of the number of haemagglutinin units (HAUs) per millilitre of supernatant. i Atg5+/+ or Atg5–/– were infected with IAV at the indicated MOI for 16 h. Percentages of NP-expressing cells was determined by flow cytometry. Graphs show mean and standard deviation of biological triplicates, and data are representative of two experiments. ns, not significant (one-tailed unpaired t-test followed by Holm’s multiple testing correction)

