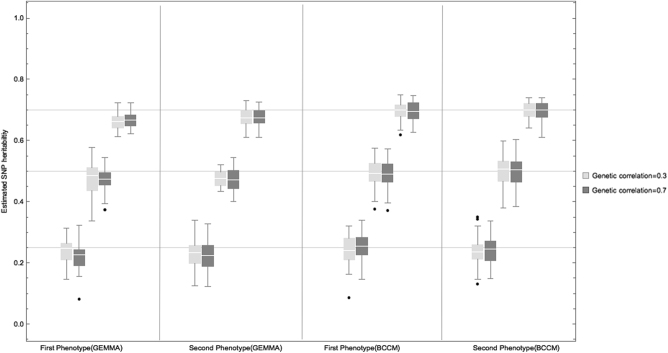
Fig. 1.
Performance of BCCM and GEMMA for SNP heritability estimation. For a given genetic correlation, the SNP heritability of the two phenotypes was estimated, and results across 50 replicates are shown in two separate box plots each correspond to a different phenotype. This was done using different magnitudes of true heritability (0.25, 0.5, 0.7). We can see that the BCCM works well under all scenarios, as average estimates almost coincide with the true heritability values (horizontal lines). There are few outliers (dots), which are expected to disappear as the number of MCMC iterations tends to infinity. On the other hand, using the same type and number of simulated data used in assessing the BCCM, GEMMA seems to slightly underestimate the true heritability (horizontal lines). The estimation accuracy of both methods will increase as the sample size tends to infinity

