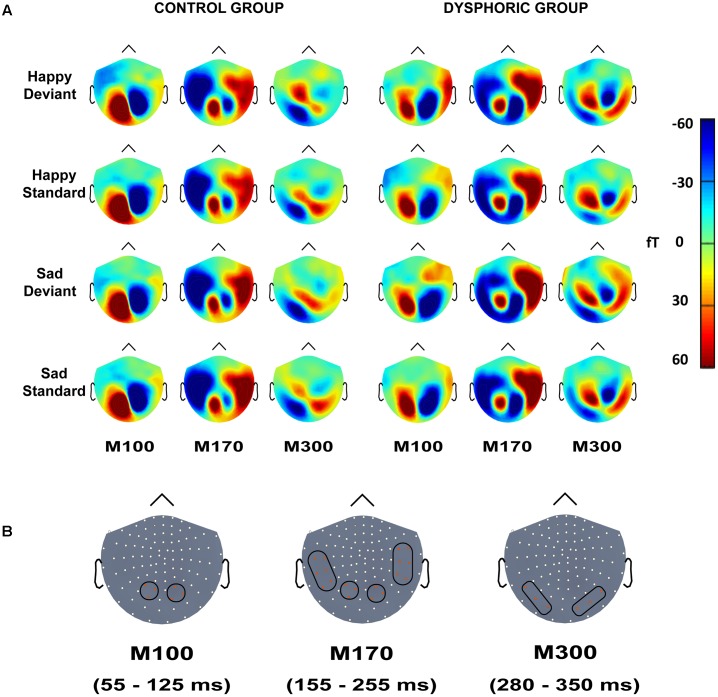
FIGURE 3.
(A) Topographic maps of grand-averaged magnetic fields for happy deviant, happy standard, sad deviant, and sad standard faces in the control (left) and dysphoric groups (right) for the M100, M170, and M300 shown here at 85, 205, and 315 ms after stimulus onset, respectively. (B) Magnetometer sensors and the regions of interests used for analyses are marked with black frames for M100, M170, and M300. Each participant’s peak values were extracted from the time windows of 55–125 ms, 155–255 ms, and 280–350 ms after stimulus onset for M100, M170, and M300, respectively.

