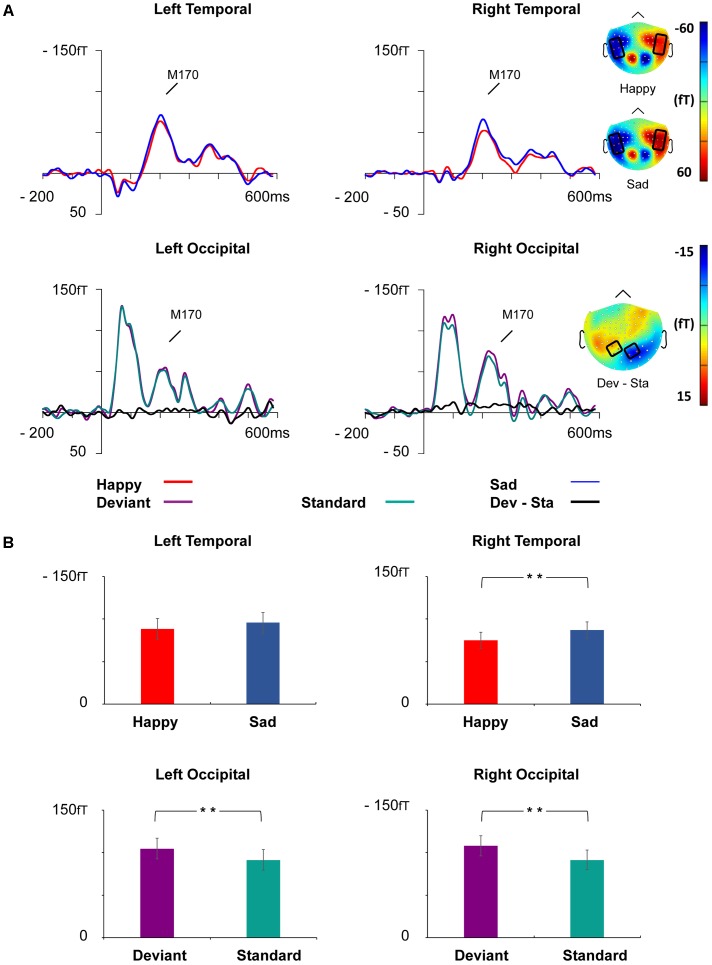
FIGURE 5.
Grand-averaged ERFs demonstrating the M170 response. (A) Upper: Waveforms of ERFs to happy and sad faces at right and left temporal ROIs and corresponding topographic maps. Lower: Waveforms of ERFs to standard and deviant faces at the left and right occipital ROIs and the topography of the vMMN (deviant – standard). Topographic maps are depicted as the mean value of activity 155–255 ms after stimulus onset. (B) Bar graph for the M170 peak amplitude values with standard errors to happy and sad faces (upper) and deviant and standard stimuli (lower) at the left and right temporal and occipital ROIs, respectively. Asterisks mark significant differences at ∗∗p < 0.01.

