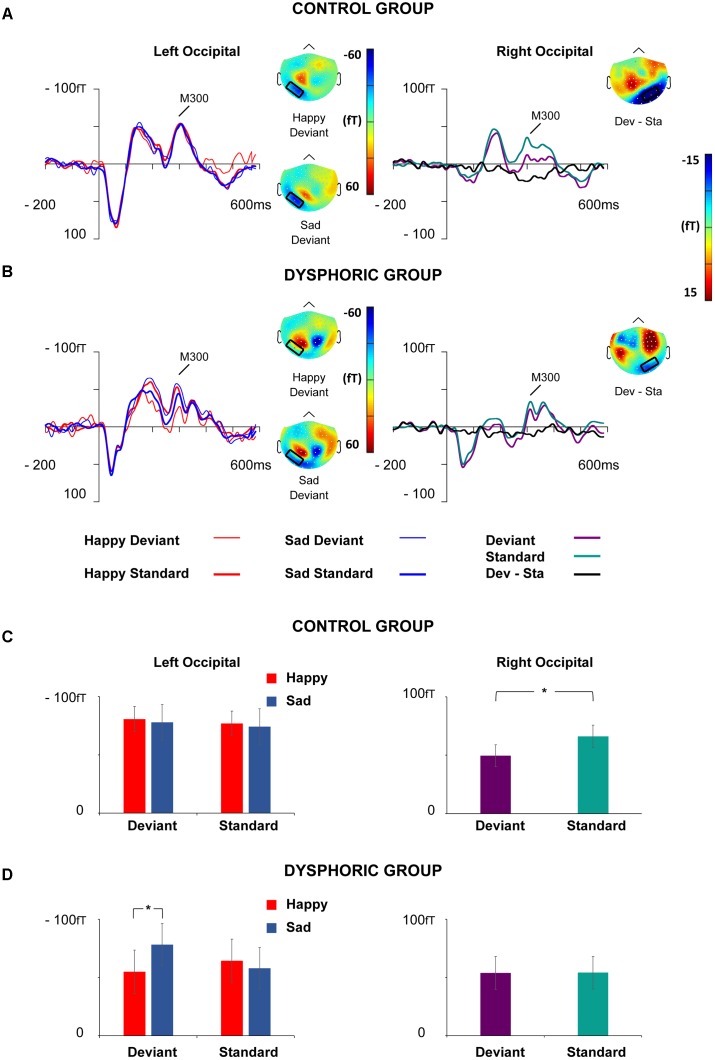
FIGURE 6.
Grand-averaged ERFs for the M300 response. Waveforms of ERFs at the left and right occipital ROIs in the control (A) and dysphoric group (B). Topographic maps of Happy and Sad Deviant (Left), and the vMMN (Deviant – Standard) responses (Right) are depicted as the mean value of activity 280–350 ms after stimulus onset. Bar graphs for the M300 peak value with standard errors at left and right occipital ROIs in the control (C) and dysphoric group (D). Note that in the left hemisphere there was an interaction effect of Emotion × Stimulus Type × Group, which showed that sad deviant faces induced more activity than happy deviant faces in the dysphoric group but not in the control group. In the right hemisphere, an interaction effect of Stimulus Type × Group was found, indicating that the vMMN was elicited in the control but not in the dysphoric group. Asterisk marks significant differences at ∗p < 0.05.

