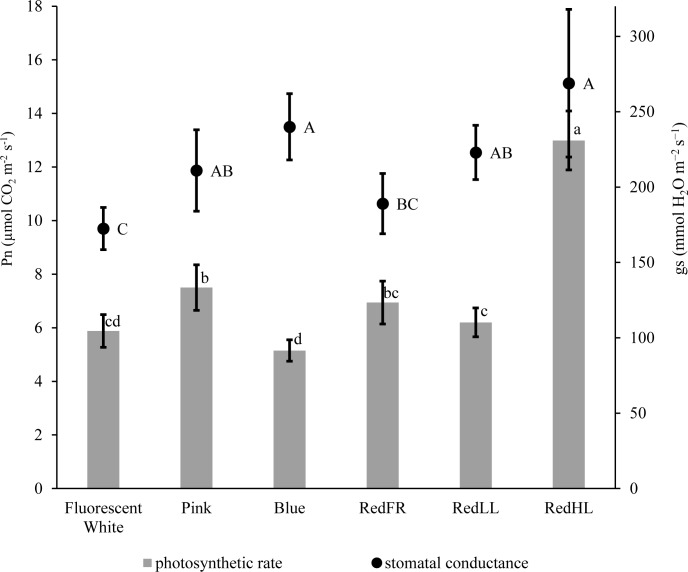
FIGURE 2.
CO2 assimilation rate (Pn) and stomatal conductance (gs) measured on flag leaves grown under different light regimens. Values are the mean ± SD of at least 5 measurements per light treatment. The different letters indicate statistically significant differences at P < 0.05, using Tukey’s post hoc test.

