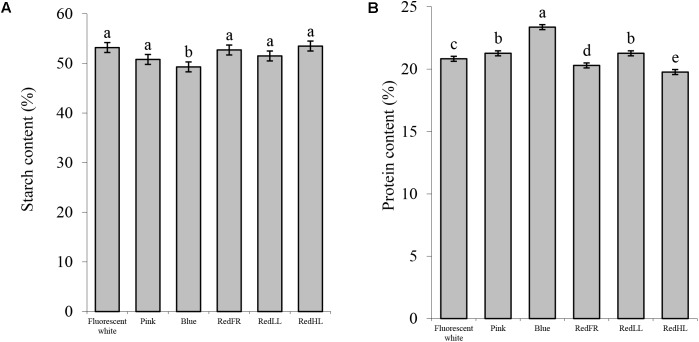
FIGURE 5.
Compositional properties of wheat flour produced under different light regimens. (A) Starch content (%). (B) Protein content (%). Values are the mean ± SD of 3 biological replicates per light treatment. The different letters indicate statistically significant differences at P < 0.05, using Tukey’s post hoc test.

