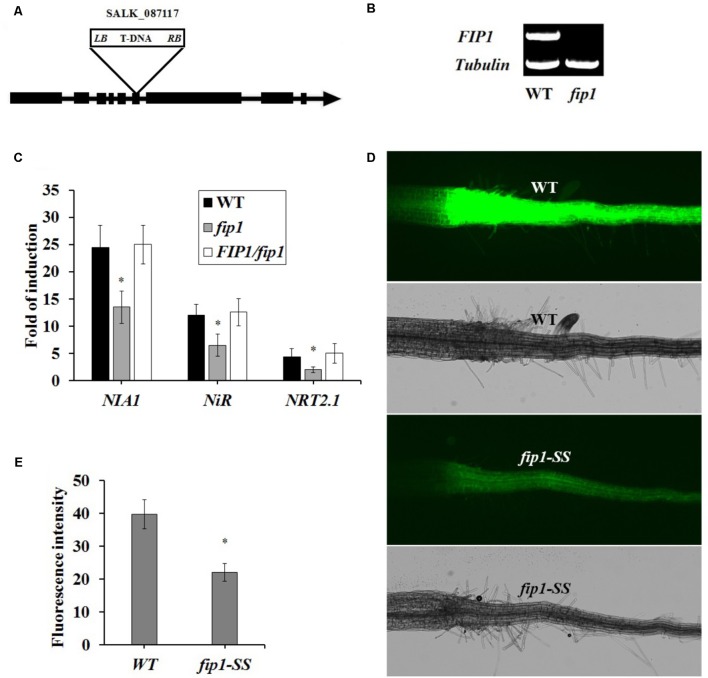
FIGURE 2.
FIP1 regulates the expression of nitrate-responsive genes. (A) Schematic map of the T-DNA insertion site in the fip1 mutant. Exons and introns are represented by black boxes and lines, respectively. The location of the T-DNA insertion in FIP1 is indicated by a triangle. (B) RT-PCR analysis of FIP1 mRNA levels in the wild type (WT) and fip1. Total RNA was isolated from 7-days-old seedlings grown on ½ MS. TUB2 serves as the internal control. (C) The expression of nitrate-responsive genes in the roots of the fip1 mutant and complementation line (FIP1/fip1). Seedlings were grown on medium with 2.5 mM ammonium succinate as the sole nitrogen source for 7 days, and then treated with 10 mM KNO3 or KCl as a control for 2 h. The transcripts of the nitrate-responsive genes were quantified using qPCR. Error bars represent the SD of the biological replicates (n = 4). Asterisks indicate significant differences (p < 0.05, U-test). (D) Nitrate responsiveness in 4-days-old fip1-SS seedlings grown on a medium containing KNO3, revealed using a fluorescent reporter system (NRP-YFP). (E) Quantification of root fluorescence in the WT and the fip1-SS mutant described in (D). Error bars represent the SD of the biological replicates (n = 60), asterisks indicate significant differences to WT (p < 0.05, U-test).

