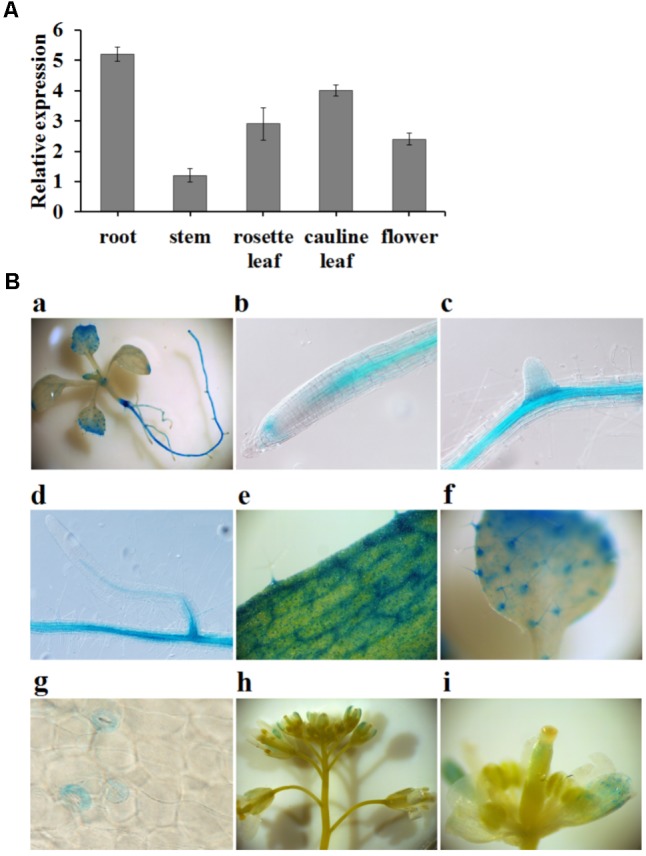
FIGURE 3.

The expression pattern of FIP1. (A) Relative expression levels of FIP1 in different tissues quantified using qPCR. Tissues were harvested either from 7-days-old plants (seedlings and roots) grown in 1/2 MS solution or 6-week-old plants (leaves, stems, and flowers) grown in soil. Error bars represent the SD of the biological replicates (n = 4). (B) Histochemical staining of GUS activity in transgenic plants expressing ProFIP1::GUS. GUS activity was detectable in the (a) whole seedling, (b) root tip, (c,d) lateral roots, (e) rosette leaves, (f) cotyledons, (g) stomata, and (h,i) flowers.
