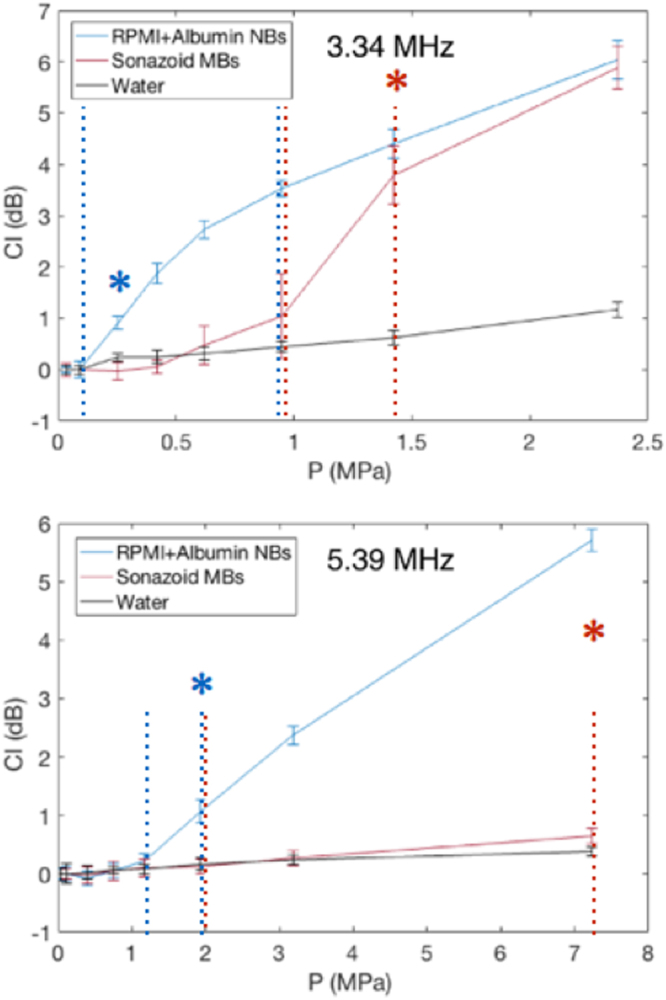
Figure 5.

Cavitation-threshold measurements for two types of bubbles at frequencies of 3.34 MHz (top) and 5.39 MHz (bottom). Error bars represent standard deviation of CI over 10 measurements for each pressure level. The blue and red dashed lines (for Albumin NBs and Sonazoid MBs, respectively) represents the pressure interval that is assumed to comprise the cavitation threshold. The asterisk states a statistically the lower pressure parameter with a significant difference relatively to the CI in degassed water (p < 0.01) (it is not displayed for higher pressures for figure clarity).
