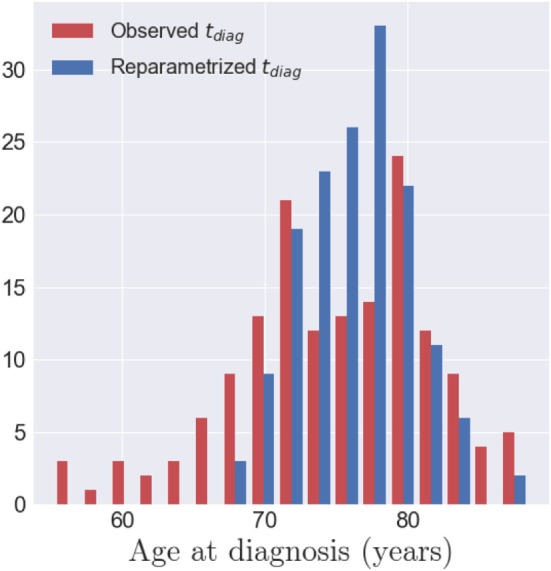
Figure 10.

In red, the histogram of the observed age at diagnosis tdiag,i for the 154 MCI converters. In blue, the histogram of the repatametrized age at diagnosis ψi(tdiag,i) once aligned on the common time-line. This shows that the age at diagnosis is mapped to a smaller range of time-points, in the model of cortical atrophy, suggesting that conversion to AD occurs at a specific stage of cortical atrophy.
