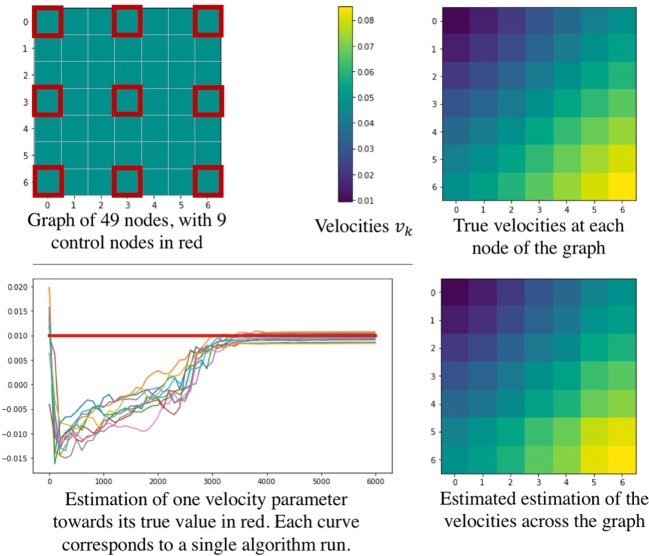
Figure 4.
Simulation study performed to show the effectiveness of the parameter estimation procedure. The upper part describes the simulated graph (left) and the true velocities across the nodes (right). On the bottom part, a convergence example is given (left) as well as the estimated velocities estimated across the graph (right).

