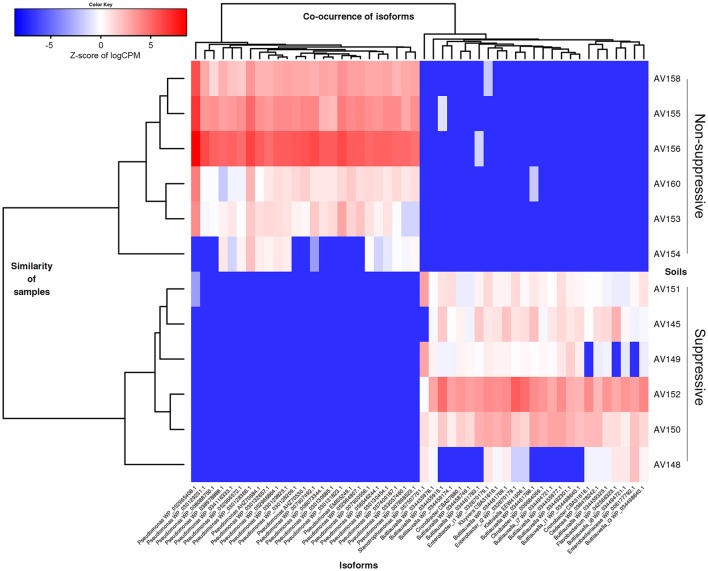
Figure 5.
Heatmap showing the abundance of contigs (isoforms) based on their taxonomic annotation with differential gene expression (FDR < 0.05, fold change ≥ 4) for the metatranscriptomic libraries of suppressive (AV145-AV152) and non-suppressive (AV153-AV160) samples, based on counts per million (CPM) sequence reads. Contigs shown have the 25 highest and lowest fold changes (logFC from −15 to −11 and from +11 to +16 and FDR < 1e-08) and were able to be annotated at genus using the NCBI nr data with their Genbank identification number shown.

