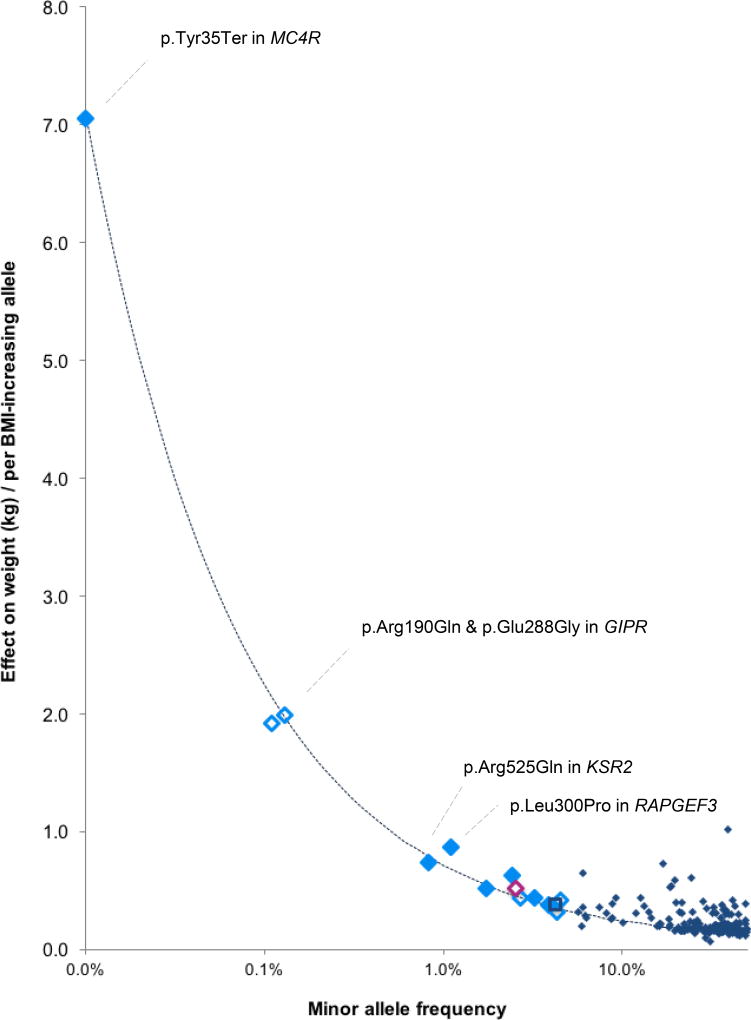
Figure 1. Effect sizes (y-axis) of the 14 BMI-associated R/LF coding variants by their minor allele frequency.
Effect sizes are expressed in body weight (kg) per allele, assuming a SD of 4.5 kg and an average-sized person of 1.7m tall. Solid markers indicate that the minor allele is associated with higher BMI, and clear markers indicate that the minor allele is associated with lower BMI. Variants were identified in all-ancestry analyses (light blue diamonds), the European ancestry analyses (dark blue square) and women-only analyses (pink diamond). Effect sizes for previously identified GWAS loci are shown in navy blue diamonds. The dotted line represents 80% power, assuming α = 2×10⁻⁷ and N= 525,000 (discovery sample size).

