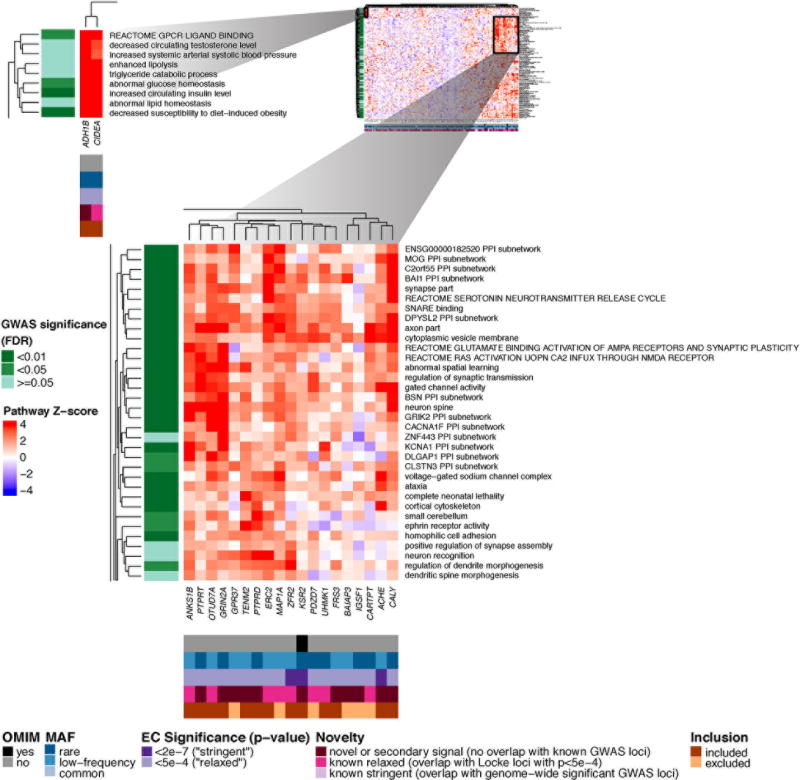
Figure 2. Heatmap showing DEPICT gene set enrichment results for suggestive and significant rare and low-frequency coding SNVs.

For any given square, the color indicates how strongly the corresponding gene (x-axis) is predicted to belong to the reconstituted gene set (y-axis), based on the gene’s Z-score for gene set inclusion in DEPICT’s reconstituted gene sets (red indicates a higher, blue a lower Z-score). To visually reduce redundancy and increase clarity, we chose one representative "meta-gene set" for each group of highly correlated gene sets based on affinity propagation clustering (Online Methods, Supplementary Note). Heatmap intensity and DEPICT P-values (Supplementary Table 17) correspond to the most significantly enriched gene set within the meta-gene set. Annotations for genes indicate (1) whether it has an OMIM annotation as underlying a monogenic obesity disorder (black/grey), (2) the MAF of the significant ExomeChip (EC) variant (blue), (3) whether the variant’s P-value reached array-wide significance (<2×10⁻⁷) or suggestive significance (<5×10⁻⁴) (purple), (4) whether the variant was novel, overlapping “relaxed” GWAS signals from Locke et al.5 (GWAS P<5×10⁻⁴), or overlapping “stringent” GWAS hits (GWAS P<5×10⁻⁸) (pink), and (5) whether the gene was included in the gene set enrichment analysis or excluded by filters (orange/brown) (Online Methods, Supplementary Note). Annotations for gene sets indicate if the meta-gene set was significant (green; FDR <0.01, <0.05, or not significant) in the DEPICT analysis of GWAS results5. Here, two regions of particularly strong gene set membership are shown (see full heat map in Supplementary Figure 10a).
