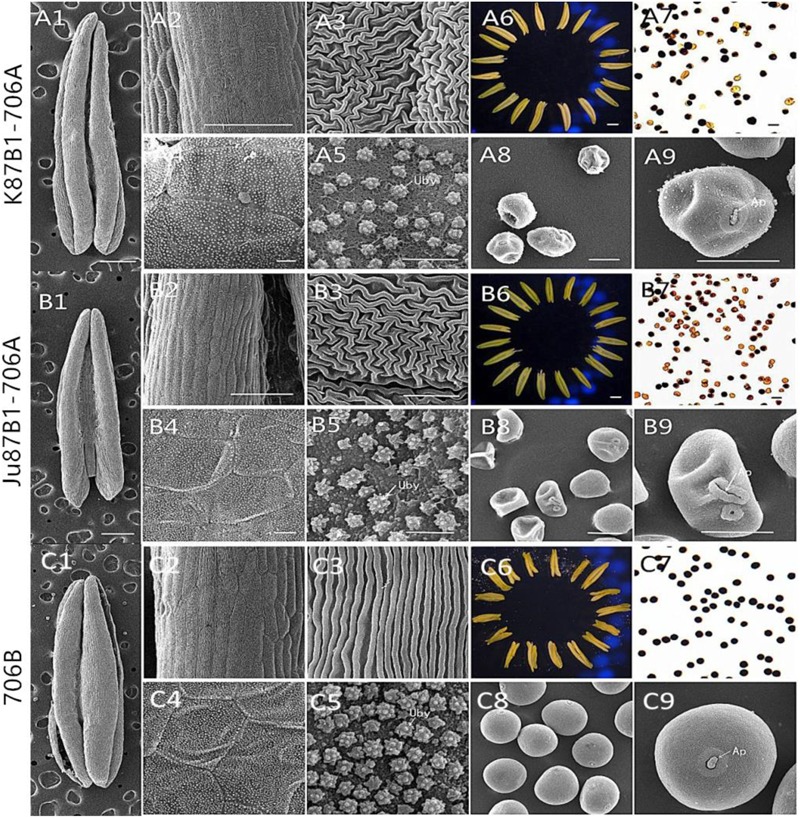
FIGURE 2.

Comparison of scanning electron micrograph observations, I2–KI staining, and anther morphology in K87B1-706A (A1–A9), Ju87B1-706A (B1–B9), and 706B (C1–C9) during the trinucleate stage. Anthers (A1,A6,B1,B6,C1,C6). Outer epidermal cells (A2,A3,B2,B3,C2,C3). Inner epidermal cells (A4,A5,B4,B5,C4,C5). Uby, Ubisch bodies. Microspores by I2-KI staining (A7,B7,C7). Microspores (A8,A9,B8,B9,C8,C9). Ap indicates the germination aperture. Scale bars = 1 mm (A1,A6,B1,B6,C1,C6); 100 μm (A2,B2,C2); 50 μm (A7–A9,B7–B9,C7–C9); and 10 μm (A3–A5,B3–B5,C3–C5).
