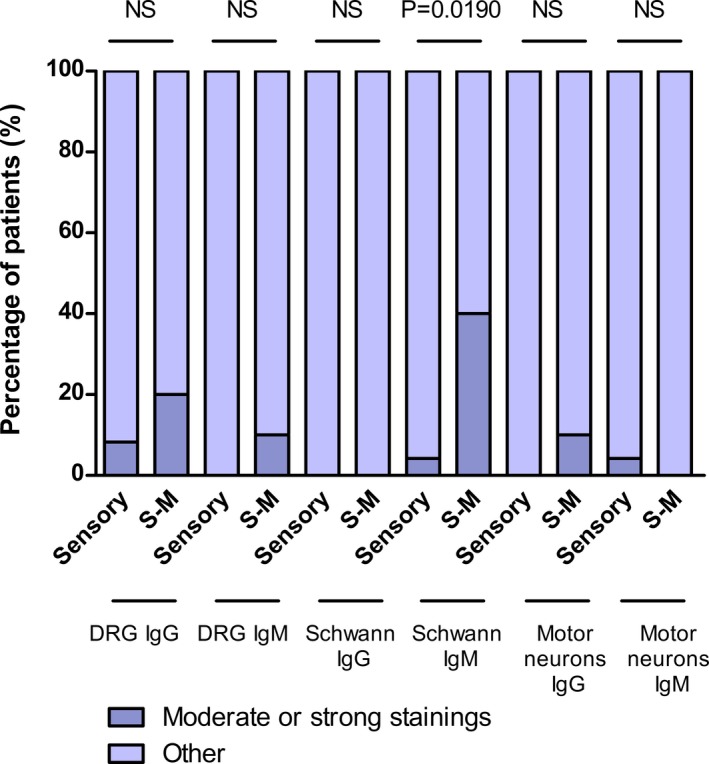
Figure 3.

Statistical comparison between PN patients with sensory neuronopathy and patients with sensory‐motor neuropathy. Statistical analysis of DRG neurons, motor neurons, and Schwann cells ICC considering moderate or strong staining in patients with sensory neuronopathy and patients with sensory‐motor (S‐M) neuropathy.
