Figure 3.

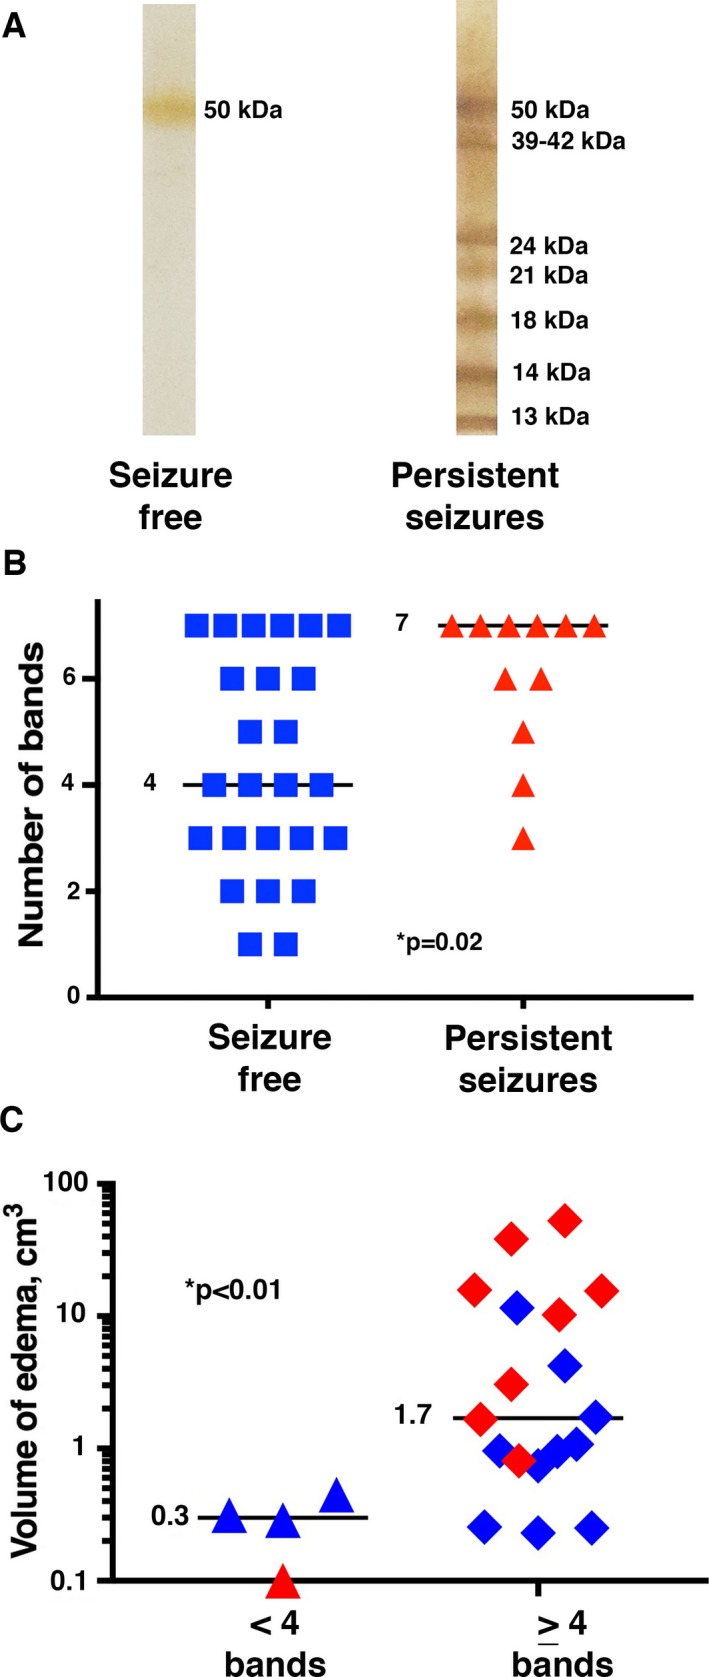
Association between persistent seizures and edema volume with western blot results. (A) shows representative NCC western blots from subjects in each group. The image on the left shows a western blot with 1 band from a subject in the seizure‐free group, while the one on the right has 7 bands (the maximum number possible) and was from a subject in the persistent seizure group. The diagnostic band groups are labeled on the right‐hand side of the western blots. (B) shows the number of bands on the baseline western blot for each subject in the seizure‐free (left, denoted by blue squares) and persistent seizure (right, denoted by red triangles) groups. The horizontal line and numbers show the median value for each group. (C) shows the volume of edema (of subjects with edema) on follow‐up T2 FLAIR images in subjects with (denoted as diamonds) and without (denoted as triangles) a strong serologic response (≥4 bands) on the baseline NCC western blot. The horizontal lines and numbers indicate the median values in each group. Subjects from the persistent seizure group are denoted in red, and those in the seizure‐free group are denoted in blue.
