
Figure 1.
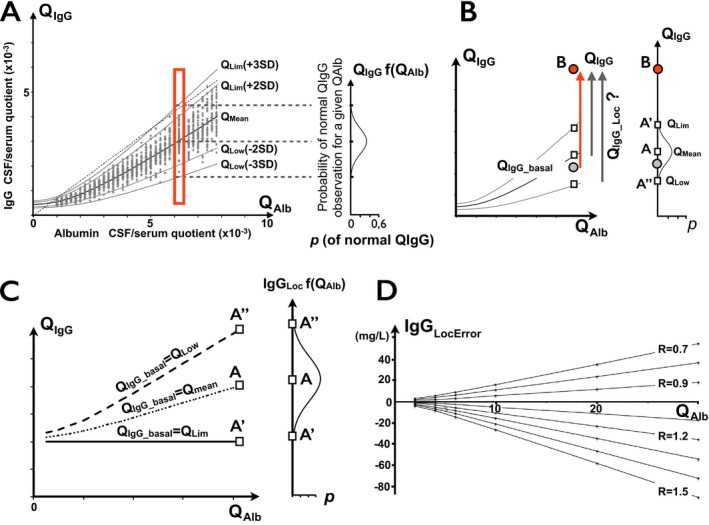
(A) CSF IgG passively diffused from blood to CSF in normal population. Plot of CSF/serum quotients with hyperbolic function of quotient ratios (“Reibergram”). Reference range defined by QL im = Q mean ± 2SD or ±3SD involving 96% and 99% of normal population, respectively. Dotted line is upper normal limit (>0.7) of IgG index, intersecting QL im curve at two points. Right insert: probability curve of basal QI gG for a given QA lb. The maximum probability is obtained for Qmean. Points are obtained from a simulated healthy population. (B). Range of calculated intrathecal IgG synthesis depending on basal QI gG estimation. True IgGL oc should be calculated based on normal QI gG_basal preceding disease onset (gray circle), which is unknown. In practice, QI gG_Loc, and therefore, IgGL oc, strongly depend on choice of possible QI gG_basal. By raising point B as a definitely abnormal QI gG (≫QL im), the range for the ratio of intrathecally synthesized IgG depends on estimation of basal (before disease onset) QI gG_basal. In individual patients, QL im(+3SD) (point A’) is usually used as an approximation of basal QI gG_basal. However, the true QI gG_basal may be anywhere on the segment A’ – A’’, with the highest probability closest to Q mean at point A. Therefore, quantitative estimation of IgG synthesis IgGL oc=(QI gG – QI gG_basal) x [IgGserum] is strongly influenced by arbitrary choice of QI gG_basal. (C) IgGL oc depending on basal QI gG estimation. IgGL oc(Lim3SD)= 20 mg/L, IgGL oc(mean) ≈ 43 mg/L. Therefore, the true IgGL oc of QI gG(B) is in the range of 20–65 mg/L. Using point B at QI gG=QL im(3SD) + 2 and [IgGserum] = 10 g/L. (D) Error range of IgGL oc calculations assuming various R ratios (R=QI gG_norm/QI gG_basal). A ratio of 1.5 is equal to QL im3SD/Q mean. Calculations assume that [IgGserum] = 10 g/L and QI gG_basal = Q mean.