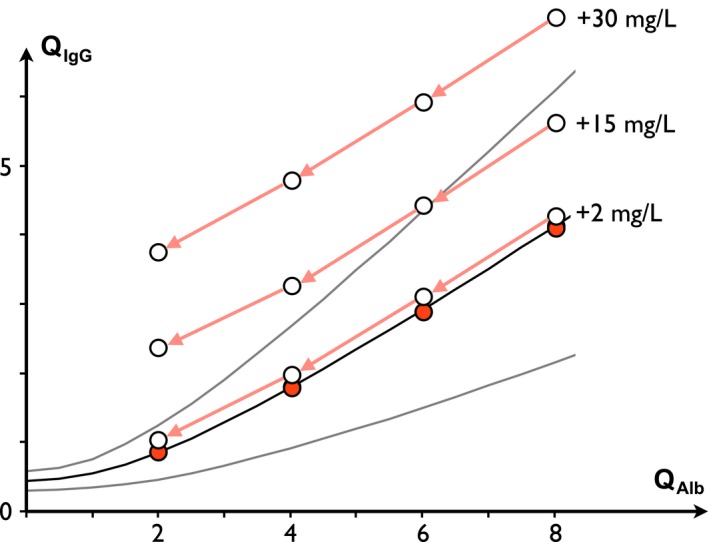
Figure 3.

Evolution of QI gG with decreasing QA lb and at constant ITS. QI gG_basal (red circles) is arbitrarily fixed as equal to Q mean and three examples of constant ITS levels are depicted (2, 15, and 30 mg/L). QI gG decreases as QA lb decreases. Since the variance of normal QI gG is skewed for lower QA lb, the QI gG values associated with an ITS may progressively reach an abnormal range as long as QA lb decreases. IgG index increases as QA lb decreases.
