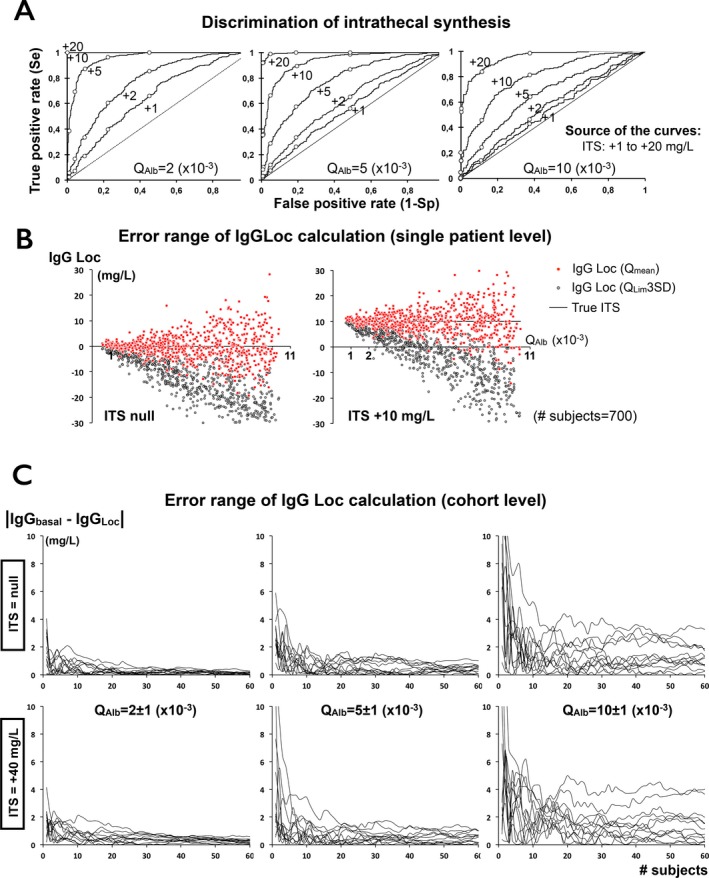
Figure 5.

Estimation of intrathecal synthesis. (A) ROC curve for various amounts of ITS and different QA lb indicating sensitivity (Se) and specificity to discriminate ITS from normal QI gG. Points from left to right give Se and Sp of IgG index, QL im(3SD), QL im(2SD), QL im(1SD), and Q mean. All AUC except one (ITS +1 mg/L at QA lb 10) are significantly different from 0.5. Low amounts of ITS are poorly discriminated by Reibergram except at very low values of QA lb. For example, AUC of ITS +5 mg/L decreases from 0.954 (0.941–0.966) at QA lb=2 to 0.667 (0.624–0.710) at QA lb=10. (B) At single patient level, calculation of IgGL oc remains unreliable, especially based on QL im. (C) Convergence of the error range (in absolute value) of IgGL oc calculation at a cohort level. Convergence toward the exact ITS value is independent from amount of ITS, but strongly depends from QA lb. Fewer than 10 patients are required to compensate extreme outliers. Formula is: |mean(IgGL oc_true) – mean(IgGL oc calculated)|. For each condition (QA lb; ITS), up to 60 subjects are included in 12 independent simulated assays.
