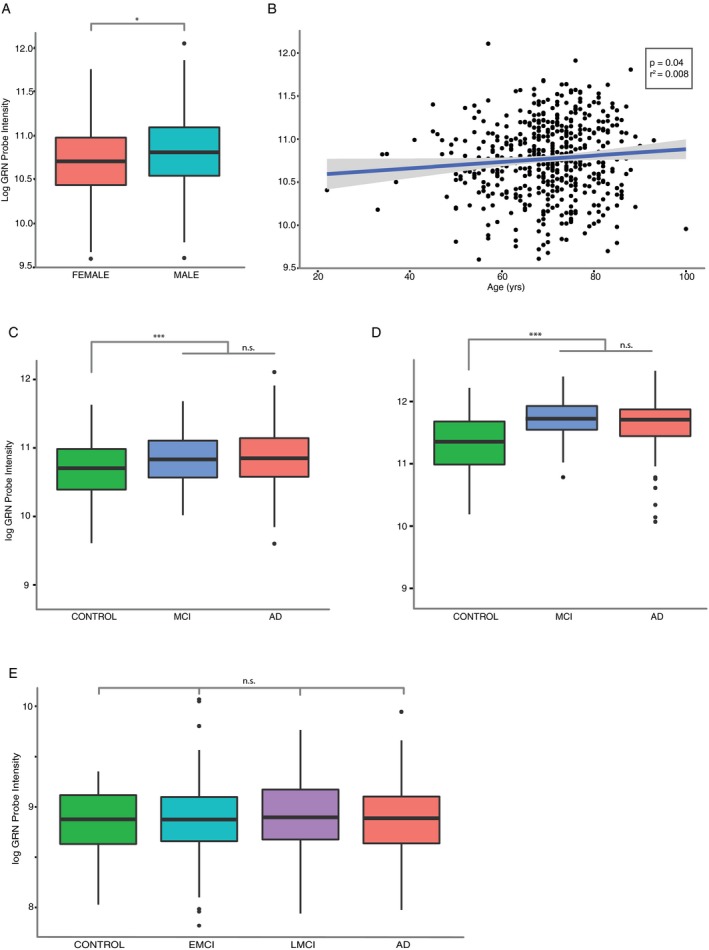
Figure 1.

Effect of demographic characteristics and disease status on peripheral blood GRN gene expression. (A) Progranulin gene expression is higher in males than females. UCSF‐MAC cohort, Welch's t‐test. (B) Progranulin gene expression increases with age across diagnostic categories. UCSF‐MAC cohort, linear regression. (C) Progranulin expression is higher in AD and MCI patients compared with controls. UCSF‐MAC cohort, F‐test and analysis of variance (AOV) with Tukey's post hoc test. (D) same as (C) in the AddNeuroMed cohort. (E) lack of difference in progranulin expression in AD, early MCI (EMCI), and later MCI (LMCI) patients compared with controls. ADNI cohort, F‐test and aov with Tukey's post hoc test. General cohort characteristics are described in Table 1. (A, C, D, E) standard boxplot representing median and interquartile range (IQR), whiskers represent 1.5 IQR greater or less than the upper and lower quartile. (B) scatterplot with line of best‐fit. *P < 0.05, ***P < 0.001, n.s. P > 0.05.
