Figure 4.

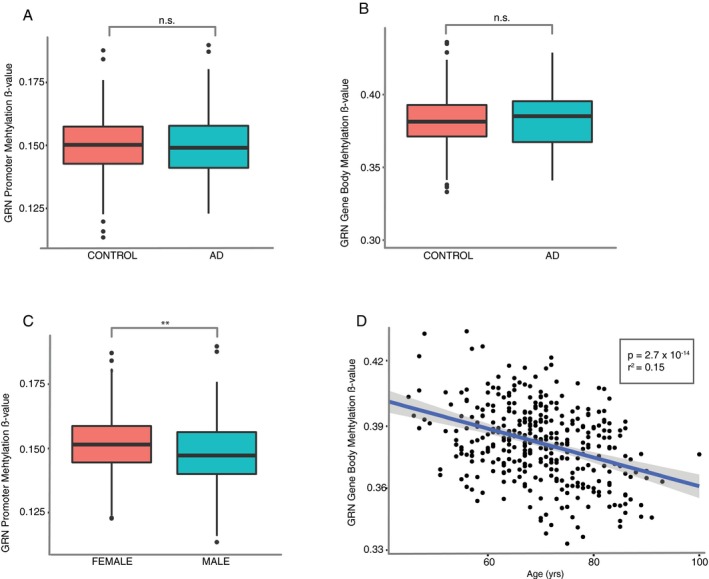
Analysis of GRN promoter and gene body DNA (CpG) methylation in DNA from peripheral blood. (A–B) lack of difference in promoter (A) or gene body (B) methylation between AD and control patients. n = 355, Welch's t‐test. (C) GRN promoter methylation is significantly lower in males compared with females across diagnostics categories. Welch's t‐test. (D) GRN gene body methylation decreases with age. Linear regression. All analysis performed with the UCSF‐MAC cohort. (A‐C) standard boxplot representing median and IQR, whiskers represent 1.5 IQR greater or less than the upper and lower quartile. (D) scatterplot with line of best‐fit. **P < 0.01, n.s. P>0.05.
