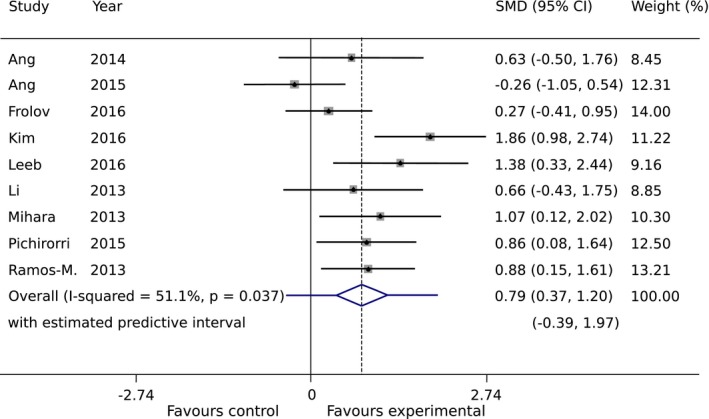
Figure 3.

Intervention effect measured as changes in upper‐extremity Fugl‐Meyer Assessment (FMA‐UE) scores between pre‐ and postintervention (standardized mean difference (SMD), Random‐Effects). The mean effect is represented as a diamond in the forest plot, whose width corresponds to the 95% CI, whereas the PI is shown as a bar superposed to the diamond. Box sizes reflect the contribution of the study toward the total intervention effect.
