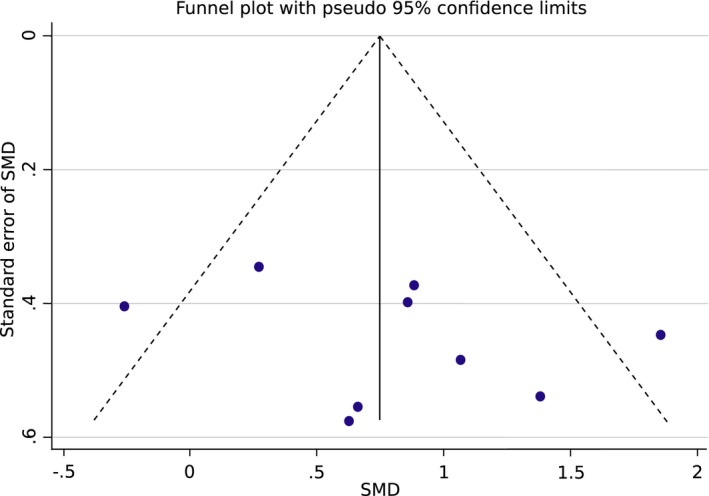
Figure 6.

Funnel plot showing the precision (standard error of standardized mean difference, SMD) against the effect size (SMD). The continuous vertical line shows the position of the overall combined effect, whereas dotted lines show pseudo 95% confidence limits.
