
Fig. 5.
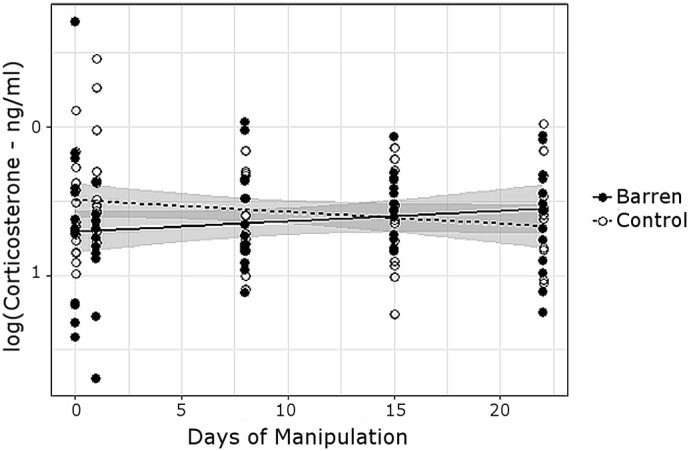
Change through the experimental phase in logged baseline corticosterone (ng/ml) within treatments. Confidence intervals are shaded around regression lines. Data at 0 on the x axis corresponds to baseline data.
Official websites use .gov
A
.gov website belongs to an official
government organization in the United States.
Secure .gov websites use HTTPS
A lock (
) or https:// means you've safely
connected to the .gov website. Share sensitive
information only on official, secure websites.
Change through the experimental phase in logged baseline corticosterone (ng/ml) within treatments. Confidence intervals are shaded around regression lines. Data at 0 on the x axis corresponds to baseline data.