
FIGURE 1.
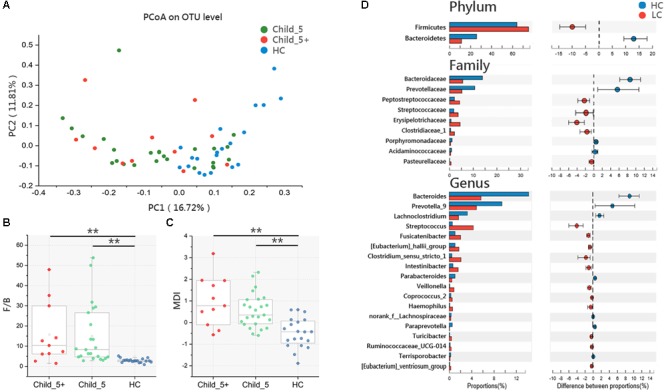
Microbiota study in LC patients and HC. (A) PCoA analysis based on Bray_Curtis distance between HC and LC [Pr(>F) = 0.0068, pMANOVA], Child_5 and Child_5+ sub-group in LC [Pr(>F) = 0.24, pMANOVA]. (B) F/B ratio and (C) MDI comparison between groups. Boxes represented the 25 to75th percentile of the distribution; the median was shown as a thick line in the middle of the box; whiskers extend to values with 1.5 times the difference between the 25th and 75th percentiles, Wilcoxon rank-sum test, ∗∗p < 0.01. (D) Comparisons of the relative bacterial abundance at phylum, family and genus levels in LC and HC, Wilcoxon rank-sum test, multiple hypothesis tests were adjusted for comparison and only hypothesis tests got pfdr < 0.05 were displayed. HC (n = 20), LC (n = 36, Child_5, n = 25; Child_5+, n = 11).