Figure 1.
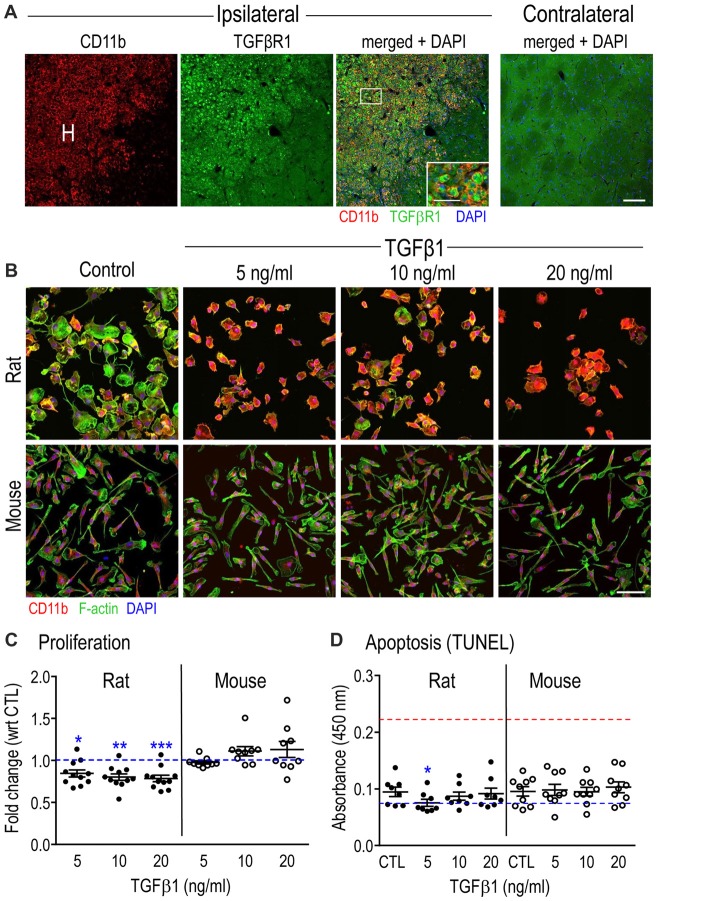
Transforming growth factor β1 (TGFβ1) receptor in microglia after Intracerebral hemorrhage (ICH), and general effects of TGFβ1 on microglia in vitro. (A) Microglia/macrophages increase in the hematoma (H) after ICH and express TGFβR1. Representative confocal micrographs taken at 7 days in the damaged ipsilateral rat striatum (left) and the undamaged contralateral striatum (right). The inset is a higher magnification image of the boxed area (scale bar, 20 μm) showing microglia and infiltrating macrophages in the hematoma labeled with CD11b (OX-42 antibody; red) and TGFβR1 (green). Cell nuclei are labeled with 4’-6-diamidino-2-phenylindole (DAPI; blue). Scale bar for main images is 100 μm. (B) The morphology of isolated microglia (stained for CD11b, red, as in (A) was assessed using phalloidin to stain F-actin (green) and DAPI (blue) to label nuclei. Images are representative of results from six separate cell cultures for each species. Scale bar is 100 μm. (C) Microglia proliferation was determined 24 h after TGFβ1 treatment using the CyQUANT™ assay. Results are shown as fold-change with respect to untreated (control, CTL) microglia (blue dashed line) and expressed as mean ± SEM for 9–11 individual cell cultures. (D) Apoptosis was monitored using the TiterTACS™ colorimetric assay at 24 h after TGFβ1 treatment. Results are shown as mean absorbance at 450 nm (mean ± SEM, 8–9 individual cultures). The blue dashed line indicates values for the negative controls, and the red dashed line indicates the positive controls. Significant differences are shown between control and TGFβ1 treated cells (*). One symbol of indicates p < 0.05; 2, p < 0.01; 3, p < 0.001.

