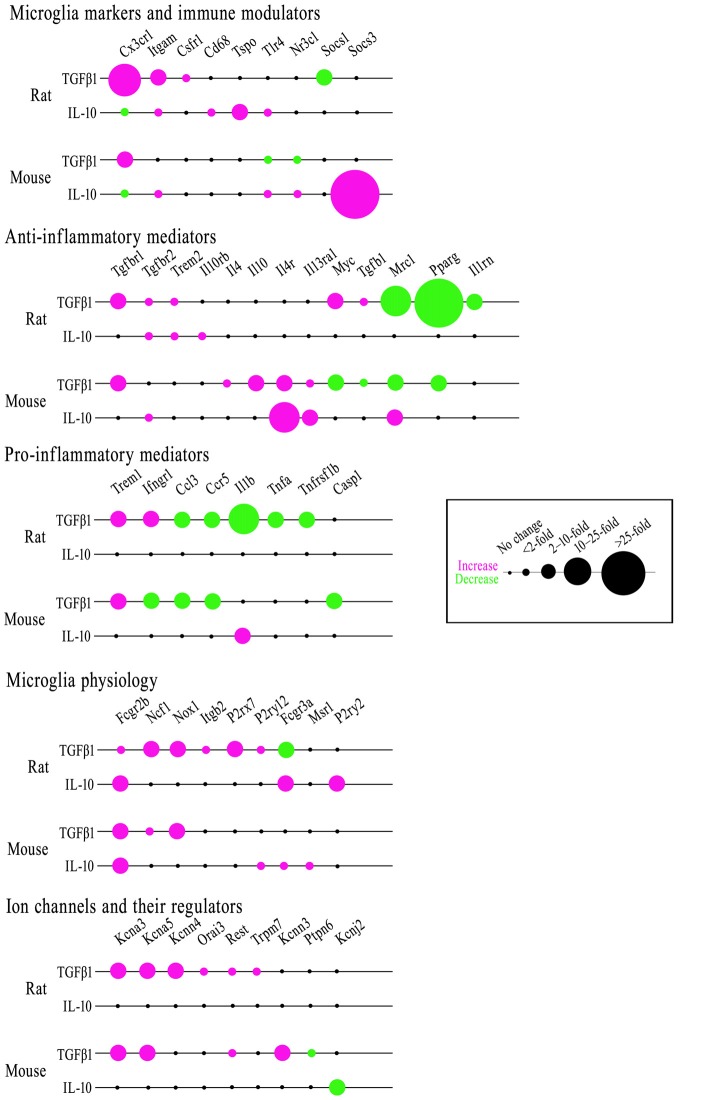
Figure 8.
Comparing effects of TGFβ1 and IL-10 on gene expression in rat and mouse microglia. Microglia were stimulated with either cytokine for 24 h. mRNA transcript levels were determined by NanoString, expressed as fold-change relative to unstimulated control cells (p < 0.05 after FDR correction; n = 4–6 individual cultures). The bubble chart shows gene expression changes, sorted into bins according to ranges in the fold change. Magenta indicates increased expression; green shows decreases.

