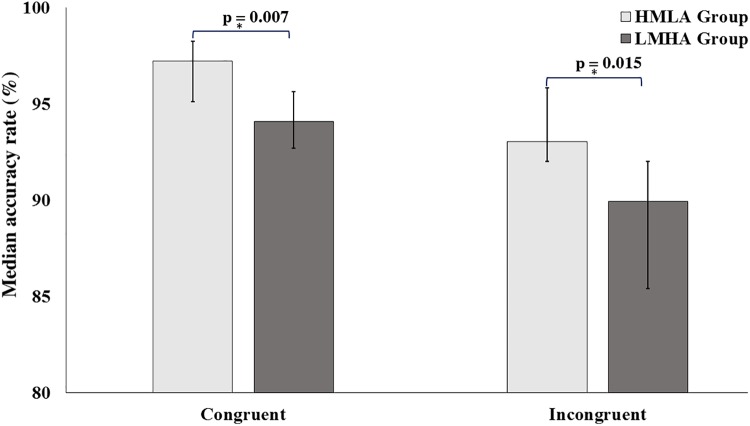
FIGURE 1.
Median Accuracy rate (%) on the CST in congruent and incongruent conditions. Error bars represent bias corrected 95% confidence intervals. The MWU showed that the HMLA group were better in accuracy in both the congruent (r = 0.349, p = 0.014) and incongruent (r = 0.316, p = 0.015) conditions. ∗p-Values reported here are after Holm–Bonferroni corrections.

