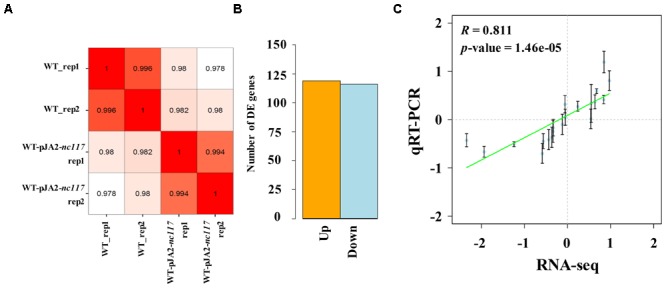
FIGURE 3.

RNA-seq results analysis. (A) Pearson correlation analysis between all biological RNA-sample. (B) Differential expression analysis of RNA-seq. (C) Correlation between qRT-PCR and RNA-seq analyses for selected genes. For RNA-seq (horizontal coordinate), values represent log2 fold change of transcripts. For qRT-PCR (vertical coordinate), values represent the mean log2 fold change in transcripts. The error bar represents the standard deviation of three technical and three biological replicates. The Pearson correlation coefficients and their significances are indicated at the right lower corner of each plot.
