FIGURE 4.

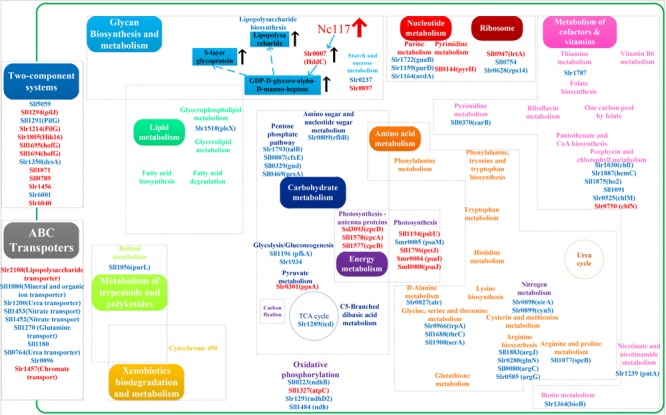
Scheme of global effects of sRNA Nc117 revealed by RNA-seq analysis. The metabolic features presented were deduced by RNA-seq analysis, and up-regulated genes (red) and down-regulated genes (blue) were labeled, respectively.

Scheme of global effects of sRNA Nc117 revealed by RNA-seq analysis. The metabolic features presented were deduced by RNA-seq analysis, and up-regulated genes (red) and down-regulated genes (blue) were labeled, respectively.