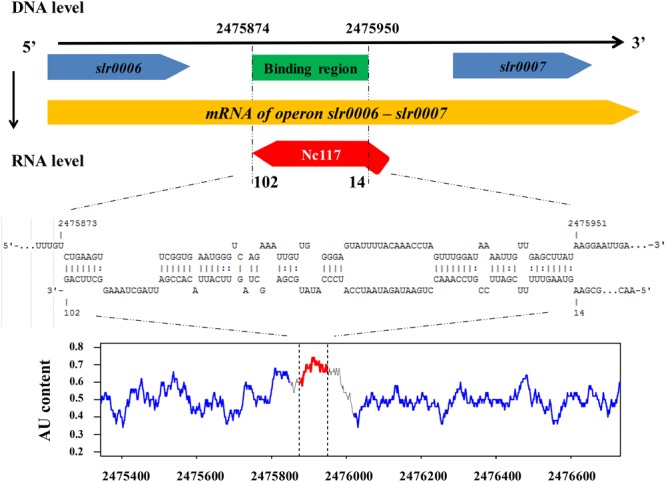
FIGURE 6.

Interaction model of Nc117 and the target gene. The upper part shows the location and interact region between Nc117 and slr0006-slr0007 operon in DNA level and RNA level. The lower part indicated the AU content (box in 50 bp) of slr0006-slr0007 operon, red represents interact region and blue represents gene slr0006 (left) and slr0007 (right) coding sequence.
