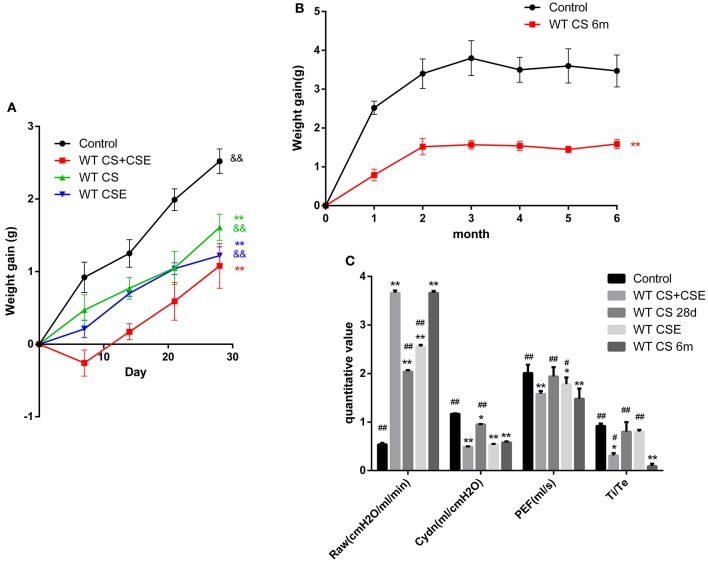
Figure 1.
Changes of body weight and lung functions of WT mice models by different methods. (A,B), trends of mice body weight in modeling days of different group. (C) lung functions of mice in different group. Raw, Airway resistance; Cdyn, lung dynamic compliance; PEF, peak expiratory flow; Ti /Te Inspiratory time/expiratory time. *Compared with control group, p < 0.05; **compared with control group, p < 0.001; #compared with WT CS 6m group, p < 0.05; ##compared with WT CS 6m group, p < 0.001. &compared with WT CS+CSE group, p < 0.05; &&compared with WT CS+CSE group, p < 0.001 Error bars: mean ± SEM. n = 5.

