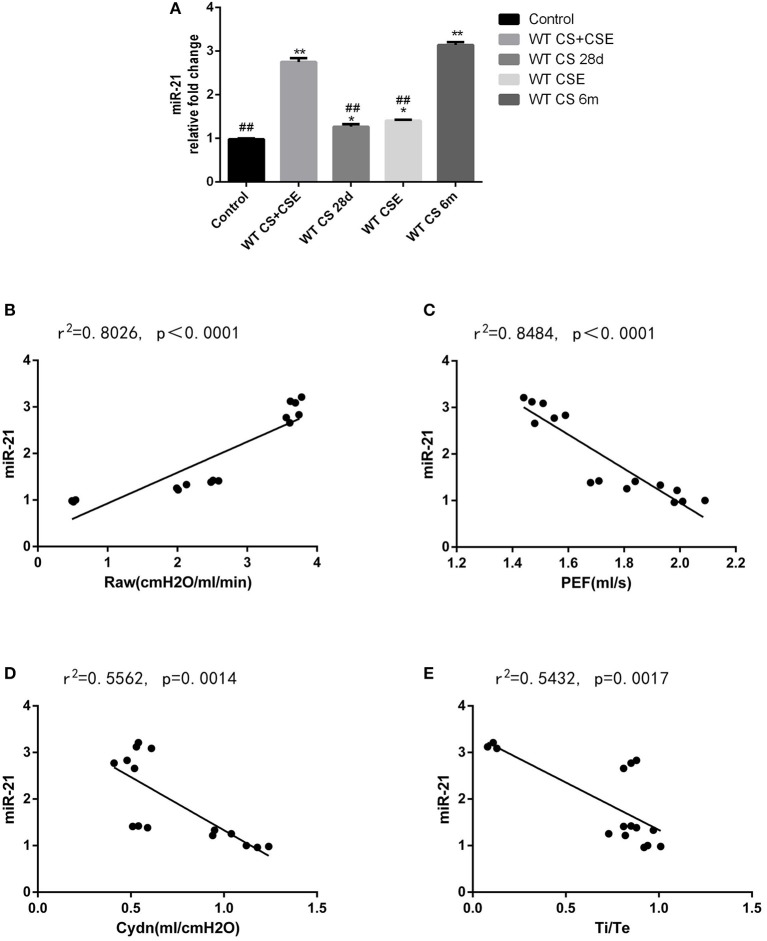
Figure 3.
Level of miR-21 in WT mice lungs from different group and the correlation analysis between the level of miR-21 and lung functions. (A) Level of miR-21 in WT mice lungs from different group, 2−ΔΔCT method. (B) correlation analysis between the level of miR-21, and Airway resistance (Raw); (C) correlation analysis between the level of miR-21 and lung dynamic compliance (Cdyn); correlation analysis between the level of miR-21 and peak expiratory flow (PEF); correlation analysis between the level of miR-21 and inspiratory time/expiratory time (Ti /Te). *Compared with control group, p < 0.05; **compared with control group, p < 0.001; #compared with WT CS 6m group, p < 0.05; ##compared with WT CS 6m group, p < 0.001. Error bars: mean ± SEM. n = 5.

